Even with a nice rally in the market to start the new year, there are a lot of stocks that remain at or near 52-week, or even historic lows. If you like looking for value as I do, that’s actually a pretty nice problem to have; it means that there are plenty of options to consider and evaluate at any given point in time. You have to be careful, though because Mr. Market is actually pretty good at pricing a company’s fundamentals into a stock’s price. That means that sometimes, a cheap stock is just a cheap stock, and could actually be a bigger risk than it is an opportunity.
Mohawk Industries Inc. (MHK) is an example of a stock that has seen uncertainty and volatility really beat the stock down over the past year. Since hitting a high at nearly $287 per share in December 2017, the stock dropped to below $110 before the end of 2018. The stock has rallied about 10% over the last month, which means that it could be setting up a nice, short-term upward trend. The company operates in a segment that has some sensitivity to economic cyclicality, since Household Durables stocks tend to see the best results when the economy is healthy. While employment is healthy, and wages continue to grow, consumers are more likely to invest in home improvement projects, which usually translates nicely for these types of stocks.
The real question right now, of course, comes back to the idea I suggested at the beginning of this article: has the stock’s decline over the past year made it a terrific bargain, or is Mr. Market saying something about the company’s fundamentals you shouldn’t ignore? Let’s run the numbers so you can decide for yourself.
Fundamental and Value Profile
Mohawk Industries, Inc. is a flooring manufacturer that creates products for residential and commercial spaces around the world. The Company’ segments include Global Ceramic, Flooring North America (Flooring NA) and Flooring Rest of the World (Flooring ROW). Its manufacturing and distribution processes provide carpet, rugs, ceramic tile, laminate, wood, stone, luxury vinyl tile and vinyl flooring. The Global Ceramic segment designs, manufactures, sources, distributes and markets a line of ceramic tile, porcelain tile and natural stone products used in the residential and commercial markets for both remodeling and new construction. The Flooring NA segment designs, manufactures, sources, distributes and markets carpet, laminate, carpet pad, rugs, hardwood and vinyl. The Flooring ROW segment designs, manufactures, sources, distributes and markets laminate, hardwood flooring, roofing elements, insulation boards, medium-density fiberboard (MDF), chipboards, and vinyl flooring products. MHK’s current market cap is $9.5 billion.
Earnings and Sales Growth: In the last twelve months, earnings declined a little more than -12% while revenues increased almost 4%. In the last quarter, earnings declined about -6% while sales were also negative, declining a little more than -1%. The company operates with a healthy, stable operating margin; for both the last twelve months and the last quarter, Net Income was about 8.9%
Free Cash Flow: MHK’s free cash flow is adequate at about $319 million for the last twelve months. That translates to a modest Free Cash Flow Yield of 3.37%.
Debt to Equity: MHK has a debt/equity ratio of .20. This is a low number that looks encouraging at first glance; however I don’t really think that it tells the story properly, since the company’s balance sheet shows only $91 million in cash and liquid assets versus more than $1.5 billion in long-term debt. Cash dropped dramatically in the last quarter, from about $500 million in mid-2018.
Dividend: Like most stocks in this industry, MHK does not pay a dividend.
Price/Book Ratio: there are a lot of ways to measure how much a stock should be worth; but one of the simplest methods that I like uses the stock’s Book Value, which for MHK is $101.49 per share. That translates to a Price/Book ratio of 1.25 at the stock’s current price. The stock’s historical Price/Book ratio is 2.42, suggesting the stock is undervalued in a big way right now, trading at a 48% discount that is supported by a Price/Cash Flow that is 55% below its historical average. These two metrics put the stock’s “fair price” between $245 and $283 per share, and near to its highs from a little over a year ago.
Technical Profile
Here’s a look at the stock’s latest technical chart.
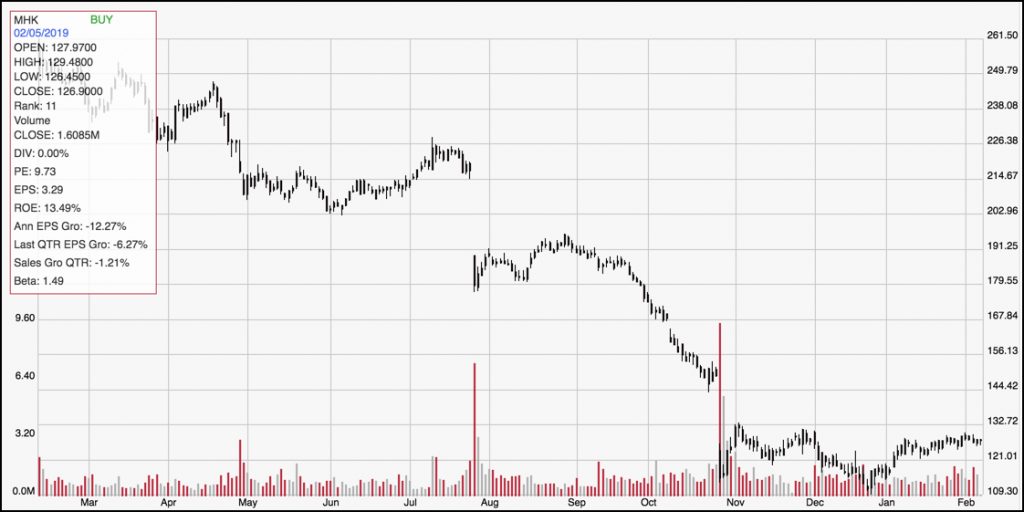
Current Price Action/Trends and Pivots: The chart above outlines the stock’s movement over the past year. The stock’s downward trend is clear, but has stabilized and established a clear consolidation pattern through the last quarter of 2018. That pattern has put a very strong resistance level at around $133 per share, with support at around $120. A break above resistance at around $133 could see the stock rally quickly to around $145 per share, while a drop below $120 could give the stock room to retest its multi-year low at around $109 per share.
Near-term Keys: A break above $133 could present an interesting short-term bullish trading opportunity using call options or buying the stock; however if the stock breaks down and drops below $120, you could consider shorting the stock or working with put options. Is the stock a good value at this price? The fundamentals aren’t terrible; however I think that liquidity is a concern and could act as a drag on profitability in the first part of the year. I would prefer to see measurable improvement in the company’s free cash flow, including cash and liquid assets before I took the stock’s value proposition seriously.