Yesterday I was interested when I saw a headline indicating that since the beginning of the year, only 3 of the 11 total sectors identified by Standard & Poor’s remain at correction levels. That’s a pretty impressive recovery in the last five weeks or so, when every sector in the market was testing bear market territory. Does that mean that the market is poised to push back towards the highs it set in September of 2018, or possibly even set new highs? Maybe; but for now, the market remains in flux, with plenty of news and data out there that could still push things back to the downside. Caution remains the buzzword for now if you’re a bullish investor, and I think that is going to continue to be the case for the foreseeable future.
Among the sectors that have rebounded nicely since late December is Consumer Staples, which has rallied nearly 10% since finding an intermediate trend bottom in late December as measured by the S&P Consumer Staples Sector SPDR ETF (XLP). One of the biggest companies in the Food Products industry is Conagra Brands Inc (CAG). This stock has been on my radar for the last couple of months as a stock with an interesting value proposition, and it grabbed my attention immediately in mid-December when I watched the stock plunge in just two days from about $30 per share to a new multi-year low around $21. The stock is now hovering around $22, and appears to be establishing a narrow consolidation base.
The severity, and rapidity of the drop begs the question: what happened? CAG is a company that has carried a solid fundamental profile for some time. The stock’s most recent earnings announcement was on December 20, and it came in significantly lower than most analysts had forecast. The market reacted, severely and immediately. Does that mean that the fundamentals are deteriorating to the point that you should stay away from this stock, or does it mean that the market overreacted, and the stock’s value proposition, which was already interesting, just got a lot better? Let’s find out.
Fundamental and Value Profile
Conagra Brands, Inc., formerly ConAgra Foods, Inc., operates as a packaged food company. The Company operates through two segments: Consumer Foods and Commercial Foods. The Company sells branded and customized food products, as well as commercially branded foods. It also supplies vegetable, spice and grain products to a range of restaurants, foodservice operators and commercial customers. Conagra Foodservice offers products to restaurants, retailers, commercial customers and other foodservice suppliers. The Company also operates in the countries outside the United States, such as Canada and Mexico. The Company’s brands include Marie Callender’s, Healthy Choice, Slim Jim, Hebrew National, Orville Redenbacher’s, Peter Pan, Reddi-wip, PAM, Snack Pack, Banquet, Chef Boyardee, Egg Beaters, Rosarita, Fleischmann’s and Hunt’s. The Company sells its products in grocery, convenience, mass merchandise and club stores.CAG’s current market cap is $10.8 billion.
Earnings and Sales Growth: Over the last twelve months, earnings and sales both grew nicely, with earnings increasing almost 22%, and sales growing about 9.5%. In the last quarter, earnings improved about 42.5%, while Revenues improved by almost 30%. Growing earnings faster than sales is hard to do, and generally isn’t sustainable in the long term; but I also take it as a positive mark of management’s ability to maximize their business operations. The company’s margin profile over the last twelve months is healthy, with Net Income running at a little over 9% of Revenues over the past year; however it did contract in the last quarter to about 5.5%. That could be a sign that costs are increasing, which could be a stumbling block in the quarters ahead.
Free Cash Flow: CAG’s free cash flow is modest, but adequate at $552 million. That translates to a Free Cash Flow Yield of about 5.19%.
Debt to Equity: CAG has a debt/equity ratio of 1.58. That number increased from .85 in the previous quarter, and the truth is that the company’s liquidity could be a problem. In the last quarter Cash and liquid assets were $442 million (up from only about $75 million in the quarter previous) versus $11.5 billion in long-term debt. Their debt number jumped higher in a big way in the last quarter, from about $3.2 to that $11.5 billion level. Their balance sheet shows that operating profits are sufficient to service the debt they have, and they don’t appear to be in any danger in that regard; however this is an area that will continue to be worth paying attention to.
Dividend: CAG pays an annual dividend of $.85 per share, which translates to an annual yield that of about 3.88% at the stock’s current price.
Price/Book Ratio: there are a lot of ways to measure how much a stock should be worth; but one of the simplest methods that I like uses the stock’s Book Value, which for CAG is $15.04. This is a positive mark of strength, since a quarter ago their Book Value was just $9.71. At the stock’s current price, their Book Value translates to an average Price/Book ratio of 3.41, which means the stock is current sitting more than 100% below a long-term target price at around $51 per share. Their Price/Cash Flow ratio is more conservative, but still attractive since it offers a discount about 57% its historical average, but that still puts an interesting target price at around $35 per share.
Technical Profile
Here’s a look at the stock’s latest technical chart.
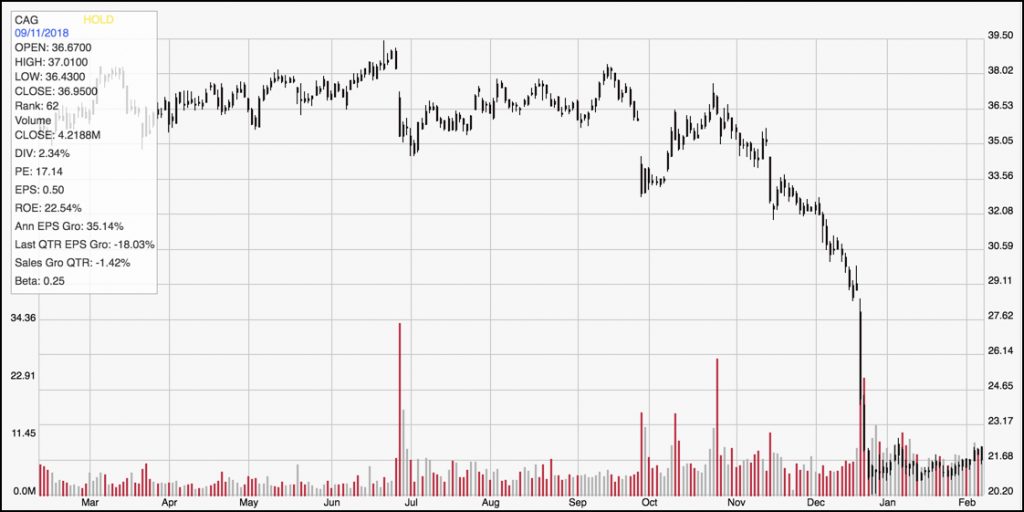
Current Price Action/Trends and Pivots: The stock’s rapid, two-day drop in December grabs your attention pretty easily, but I think the important thing now about the stock is the consolidation pattern we can see the stock has established since that drop. Top-end resistance for this narrow consolidation range is at around $22.50, which support is around $21. A break above or below either level is significant, and should give the stock to keep running in either direction. If the stock breaks above $22.50, it should be able to reclaim at least half of the distance it lost in late December following its earnings report, which would put the stock somewhere between $25 and $26; depending on conditions at that point, it could fill the remaining distance and push back to the $29 or $30 level. A drop below support at $21 could see the stock drop to lows it hasn’t seen since early 2012 in the $18 range.
Near-term Keys: A break above $22.50 should be taken as a good signal for a short-term bullish trading opportunity with either call options or buying the stock outright; in that case, look for an exit point anywhere between $25 and $26. If the stock breaks below $21, you can consider shorting the stock or buying put options, but don’t plan to hold the trade much further than the $19 to $18 range. I believe that most of the decline that came in December was an overreaction driven by the simple disappointment over numbers that failed to meet expectations. The increasing debt is a red flag, but is also primarily attributable to the company’s recent acquisition of Pinnacle Foods earlier in the year; management has expressed the conviction that the increase in debt is a temporary hit on the balance sheet that will be erased as the transition is completed and Pinnacle’s business begins to add to the company’s bottom line. In the long run, I think the value proposition is, in fact much better now than it was just about six weeks ago.