Watching the market bounce higher off of late-2018 drop that nearly pushed the major market indices to bear market levels means that it starts to get tempting to think that it’s a good time to start jumping back into stocks and get ready for the rally back to the next set of market highs. The fact is that while the broad market dropped nearly 20% off of its highs at the end of last year, it only took the market about three months to achieve that decline. That means that while the market could keep rallying, it isn’t given.
The size of the drop we saw last year was significant, but hardly consistent with the kinds of declines that are typical of bear markets that eventually lead to long-term upward trends. Historically speaking, the market usually declines more than 50% off of its previous upward trend high points before it finally finds a way to stage a new, legitimate bull market. The last two bear markets – at the beginning of this century in early 2000, and then again in early 2008 – also lasted approximately 18 months before they found a strong enough basis to motivate investors to start buying into the market on a large-scale basis.
Both the size, and the short-term time period involved in the decline I’ve seen some analysts try to use as justification for predicting a new extension of the market’s upward trend that began all the way back in 2009 are to me signs that the market remains very extended. I believe that means that while the market could rally back near to its all-time highs, or possibly even set new ones this year, I think there remains a significant level of risk in taking aggressive positions. The time to be “all in” on the stock market is not now, despite what you might hear some experts say. The market looks to me a bit like a value trap – there are some good fundamental signs that things are good right now, and that could provide some momentum in the near term to keep prices higher, but there is actually a lot more downside risk that I don’t think you should ignore.
I think that you can find examples of what I mean in the value analysis of a lot of different stocks right now. Kohl’s Corp (KSS) is a case in point. The stock is down about 22% from the high it set in November 2018 a little above $83 per share, but has rallied more than 10% off of its late December low. That could make the stock sound like a tempting momentum play right now; and if I add that the stock has a solid fundamental profile, you might start to think that it could also be a good value play. When you actually look at the stock’s valuation metrics, however, I think you start to get a better feel for what kind of risk you could be exposing yourself to by taking an aggressive stance with this stock.
Fundamental and Value Profile
Kohl’s Corporation (Kohl’s) is an operator of department stores. The Company operates approximately 1,154 Kohl’s department stores, a Website (www.Kohls.com), approximately 12 FILA outlets, and approximately three Off-Aisle clearance centers. The Company’s stores and Website sell moderately-priced private label and national brand apparel, footwear, accessories, beauty and home products. The Company’s Website includes merchandise that is available in its stores, as well as merchandise that is available only online. The Company’s merchandise mix includes both national brands and private brands that are available only at Kohl’s. The Company’s private brands include Apt. 9, Croft & Barrow, Jumping Beans, SO and Sonoma Goods for Life. The Company’s exclusive brands include Food Network, Jennifer Lopez, Marc Anthony, Rock & Republic and Simply Vera Vera Wang. KSS’s current market cap is $10.7 billion.
Earnings and Sales Growth: Over the last twelve months, earnings and sales both grew, with earnings increasing 40%, and sales growing almost 7%. Growing earnings faster than sales is hard to do, and generally isn’t sustainable in the long term; but it can also be a positive mark of management’s ability to maximize their business operations. In the last quarter, however, earnings declined more than -44%, while sales improved modestly, by 1.27%. The company’s margin profile over the last twelve months is adequate, but narrow; that is something that is consistent with most retail stocks. Net Income was 5.11% of Revenues over the past year; however it did contract in the last quarter to about 3.47%. That could be a sign that costs are increasing, which could be a stumbling block in the quarters ahead.
Free Cash Flow: KSS’s free cash flow is healthy, at $1.6 billion. That translates to a Free Cash Flow Yield of 15.3%, which admittedly is impressive.
Debt to Equity: KSS has a debt/equity ratio of .70. The company’s balance sheet is quite healthy; in the last quarter they reported more than $1 billion in cash and liquid assets against about $2.2 billion in long-term debt. Their healthy free cash flow means that even with a narrow operating profile, they should more than adequate financial ability to service their debt.
Price/Book Ratio: there are a lot of ways to measure how much a stock should be worth; but one of the simplest methods that I like uses the stock’s Book Value, which for KSS is $32.71. This is where the biggest red flags come in. At the stock’s current price, their Book Value translates to an average Price/Book ratio of 1.98, which means the stock is modestly overvalued by a little more than -6%. A more troubling sign is the fact that the stock is current trading more than 15% above its historical Price/Cash Flow ratio. Forecasting an actual bargain price on the basis of the lower of those two “fair value” measurements means that the stock would have to decline more than -33%, to about $43.50 before I would take the stock as a solid value bet.
Technical Profile
Here’s a look at the stock’s latest technical chart.
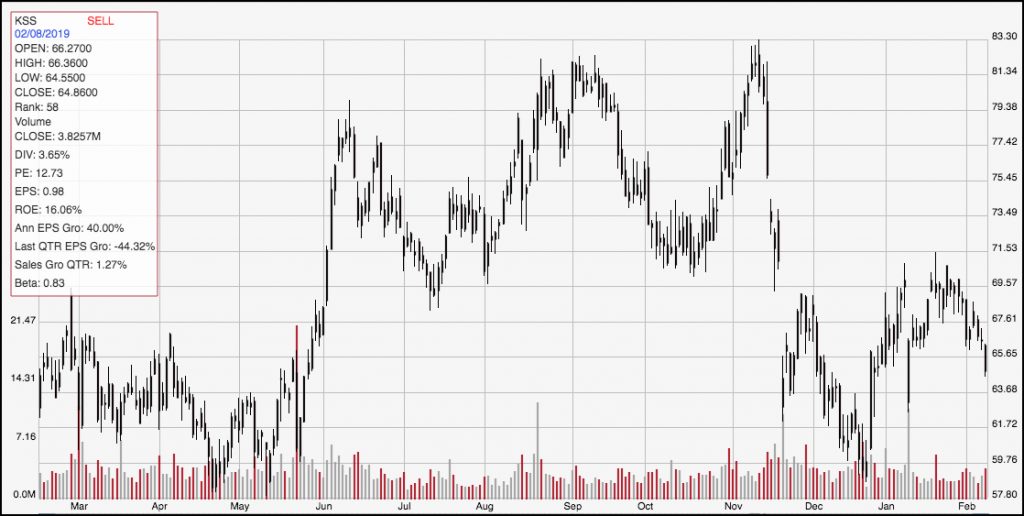
Current Price Action/Trends and Pivots: The chart above shows the last year’s worth of price movement for KSS. The stock’s rally from a late December low around $58 until late January to about $70 was impressive, and from a technical view the stock’s pull back from that point, to its current price could be seen as the second leg of a good ABC pullback pattern. If that pattern materializes, the stock should have good bullish momentum to rally to as high as $77; however it would need to break its current resistance at around $70 first. The stock’s current support is around $58, and is based on multiple pivot low points over the last year; however a break below that price could see the stock plunge much lower very easily, since its next useful previous pivot point does materialize until around $44 from levels last seen in late 2017.
Near-term Keys: A break above $70 should be taken as a good signal for a short-term bullish trading opportunity with either call options or buying the stock outright; in that case, look for an exit point around $77. If the stock breaks below $58, you can consider shorting the stock or buying put options, with a sizable drop to around $44 as your targeted exit price. From a reward: risk standpoint, trying to take any kind of bullish stance with the stock at its current price levels offers about $13 of upside, with more than $20 of downside. That isn’t a useful ratio by any measurement. The fact is that KSS is a company with a very solid fundamental profile; they are a retailer that is showing an impressive ability to survive and adapt to a changing market and consumer environment. However, as a strict value investor, the stock’s price just isn’t low enough to market a good long-term value right now.