Consumer Discretionary stocks are interesting in any market conditions because so many of them are subject to cycles that don’t necessarily coincide with normal economic cycles. One of the sub-industries within the sector that I think fit this description is tax services. That is because, moving into the latter stages of winter towards spring, one of the things that anybody over the age of 18 has to contend with is their yearly tax return. Some people prefer to do their taxes themselves, while others rely on software like TurboTax to simplify the process. This is a time of the year when a lot of other folks turn to professional tax preparation services.
If you’re trying to find a stock market investment that could dovetail with a big discount, driven by market momentum along with timely macroeconomic conditions, tax preparation tools and services could provide some interesting options to think about. One of most recognizable and established names in this particular segment of the Consumer Discretionary sector is H&R Block, Inc. (HRB). It’s pretty reasonable to suggest that in the months ahead, this is a stock that could offer an interesting opportunity based on an expected upward cycle in their annual flow of business.
Over the last year or so, HRB’s earnings have been pretty volatile, which I take as a reflection, at least in part of the varying cyclicality of the company’s business. That is an element that contributes to the stock’s volatility; since hitting a high in June a little below $30, the stock is down nearly 20%, including a little over 5% since the beginning of this year. The question, of course, is whether that decline represents a new opportunity you should take seriously.
HRB is an interesting company. Their fundamental profile is a bit mixed; their positives includes a pretty strong balance sheet, which includes good liquidity, a very high dividend yield, and healthy operating profile over the last year. The stock’s decline also represents either an intriguing value opportunity, or a dangerous value trap, depending on which measurement you prefer to focus on.
Fundamental and Value Profile
PH&R Block, Inc. (H&R Block), through its subsidiaries, provides tax preparation and other services. The Company provides assisted income tax return preparation, digital do-it-yourself (DIY) tax solutions and other services and products related to income tax return preparation to the general public primarily in the United States, Canada, Australia and their respective territories. Assisted income tax return preparation and related services are provided by tax professionals through a system of retail offices operated directly by the Company or its franchisees. It offers tax support, planning, and business accounting and advisory services to its clients. The Company offers a range of online tax services, including preparation of federal and state income tax returns, review of tax returns by a tax professional, access to tax tips, advice and tax-related news, use of calculators for tax planning, error checking and electronic filing. HRB’s current market cap is $5 billion.
Earnings and Sales Growth: Over the last twelve months, earnings decreased almost -17%, while revenues grew about 5.6%. The pattern was similar in the last quarter, with earnings declining a little more than -15% and sales increasing about 2.5%. The company operates with a margin profile of about 18% in the last twelve months, which is very high, but turned soundly negative in the last quarter, as Net Income was -$176.28 million.
Free Cash Flow: HRB’s free cash flow appears strong, at more than $762 million. That translates to a Free Cash Flow Yield of 15.3%, which is normally very attractive; however as you’ll see next, this positive data point appears to be the exception to a generally negative financial picture.
Dividend Yield: HRB’s dividend is $1.00 per share, which translates to an annual yield above 4% at the stock’s current price.
Debt to Equity: HRB has a debt/equity ratio of 2.04. This is a high number that does indicate the company operates with a high degree of leverage; however their balance sheet also indicates they have a lot of financial flexibility to work with, and that counterbalances, for the time being at least, their negative Net Income. Total cash and liquid assets in the last quarter was more than $723 million, while long-term debt is about $1.5 billion.
Price/Book Ratio: there are a lot of ways to measure how much a stock should be worth; but one of the simplest methods that I like uses the stock’s Book Value, which for HRB is -$.15 per share. That isn’t a typo, and the truth is that it makes a value analysis based on Book Value pointless. So where is the value argument? That comes from the stock’s Price/Cash Flow ratio, which is trading more than 43% below its historical average. That offers a long-term target price at nearly $43 per share.
Technical Profile
Here’s a look at the stock’s latest technical chart.
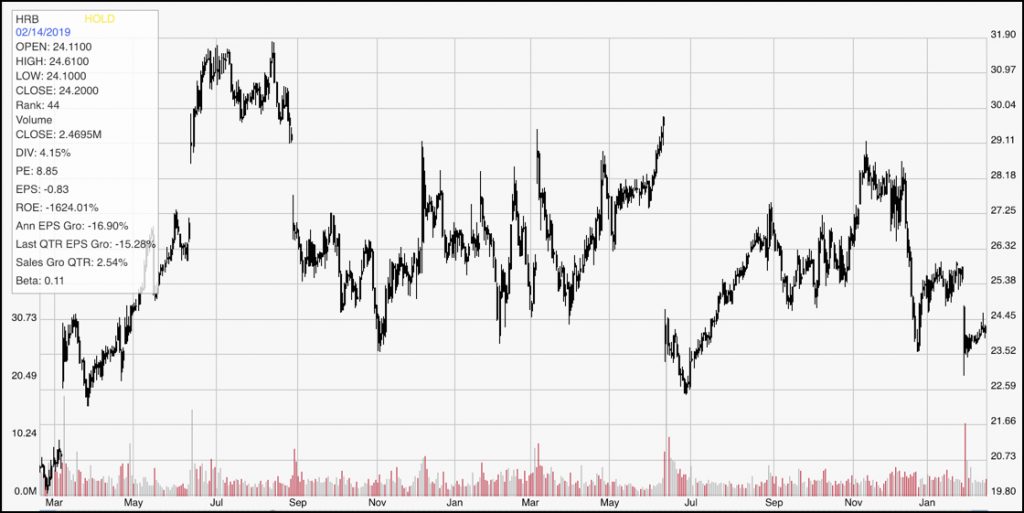
Current Price Action/Trends and Pivots: This chart traces the stock’s movement over the last two years. After reaching a multi-year peak in July 2017 at nearly $31, the stock has been pretty volatile, swinging several dollars from low to high and back again; however it’s also pretty easy to see, with the stock at around $24 per share right now that the stock’s long-term trend is definitely bearish. Right now, the stock is bouncing off of major support at around $23.50 per share. The stock’s multi-year low right now is at around $20 per share.
Near-term Keys: Given the length and slope of the stock’s downward trend, it’s hard to justify a bullish trading scenario right now, unless the stock manages to break above its nearest resistance level at around $26. That could offer an interesting short-term opportunity to use call options or buy the stock with a short-term price target at around $29 per share. The more likely short-term trade would come from a push below current support. If the stock breaks below $23.50, there is room for the stock to drop quickly to at least the $20 level, which could give a useful opportunity to short the stock or to buy put options. The stock’s Price/Cash Flow is interesting, but the fact that their Book Value – the measurement I rely on as a reflection of the company’s intrinsic value – is negative is the biggest red flag of all in my book. That makes it hard to justify any kind of long-term position for the stock.