The market has had a pretty good dose of good news so far this week; President Trump tweeted that progress in trade talks with China had progressed enough, and shown sufficient promise to ensure the imposition of new tariffs at the March 1 deadline would be delayed. The President has even gone so far as to tell state governors that a signing summit was “very, very close.” Along with that, Fed President Jay Powell testified before the Senate that the central bank would maintain its patient, “wait and see” approach and that while some risks have increased amid recent soft economic reports, economic growth for the remainder of the year should still be healthy.
Continued economic health should give most of the sectors of the stock market a pretty good basis to keep moving higher, and that would include solid growth prospects for airline stocks. For 2019, most experts are forecasting solid growth for the industry. That includes JetBlue Airways Corp (JBLU). JBLU isn’t one of the biggest names in the industry, but they have nonetheless manage to carve out a significant, profitable niche of their own.
Unlike many of its larger industry brethren, however the stock is in a multiyear downward trend, dropping off of a high in mid-2017 around $24 per share. Over the past year, the stock is down nearly 25%, but is up about 7% year-to-date. It also appears to be retracing a bit off of a recent pivot high around $18, which could set up a nice short-term upward trend pattern. Is this an opportunity to buy a good company at a nice price? Let’s take a look.
Fundamental and Value Profile
JetBlue Airways Corporation is a passenger carrier company. The Company provides air transportation services across the United States, the Caribbean and Latin America. Its segments include Domestic, and Caribbean & Latin America. It operates various kinds of aircrafts, including Airbus A321, Airbus A320 and Embraer E190. It also provides premium transcontinental product called Mint. As of December 31, 2016, Mint included 16 fully lie-flat seats, four of which were in suites with a privacy door. The Company also provides Fly-Fi in-flight Internet service across its Airbus fleet. It provides its customers a choice to purchase tickets from three branded fares, which include Blue, Blue Plus and Blue Flex. Each of these fare include different offerings, such as free checked bags, reduced change fees and additional TrueBlue points. As of December 31, 2016, its Airbus A321 aircraft in a single cabin layout had 200 seats and those with Mint premium service had a seating capacity of 159 seats. JBLU’s current market cap is $5.3 billion.
Earnings and Sales Growth: Over the last twelve months, earnings increased more than 56%, while revenues increased by 12%. In the last quarter, earnings increased 16%, while revenues decreased nearly -2%. The company operates with a margin profile that over the past twelve months was just 2.48%; in the last quarter, however that number improved measurably to 8.58%.
Free Cash Flow: JBLU’s free cash flow was only $103 million over the past twelve months and translates to an unremarkable Free Cash Flow Yield of just 1.94%.
Dividend Yield: JBLU does not pay a dividend.
Debt to Equity: JBLU has a debt/equity ratio of .29. This is a very low number that reflects a conservative approach to debt management. Their balance sheet indicates in the last quarter, cash and liquid assets were $474 million against $1.3 billion in long-term debt. The company’s improving Net Income is positive reflection that the company has more than adequate ability to service their debt.
Price/Book Ratio: there are a lot of ways to measure how much a stock should be worth; but one of the simplest methods that I like uses the stock’s Book Value, which for JBLU is $14.48 per share. That translates to a Price/Book ratio of 1.18. The stock’s historical Price/Book ratio is 1.86, which puts a long-term target price at nearly $27 per share. That’s a discount of more than 36%, which makes the stock look quite attractive from a long-term perspective.
Technical Profile
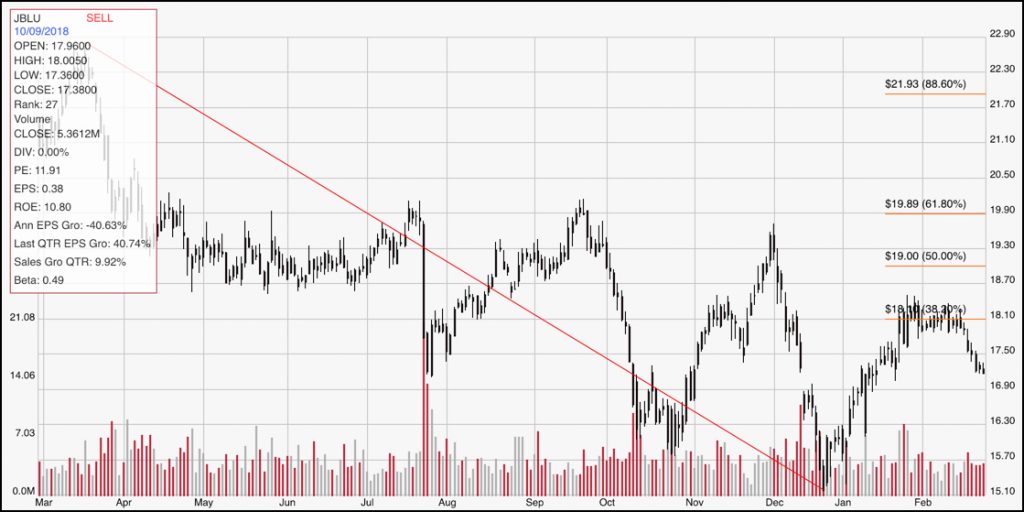
Here’s a look at the stock’s latest technical chart.

Current Price Action/Trends and Pivots: This chart traces the stock’s movement over the last year. The diagonal red line traces the stock’s downward trend; it also acts as the baseline for the Fibonacci retracement lines shown on the right side of the chart. The stock’s rally from the bottom of the trend pushed the stock right up to resistance at $18, as shown by the 38.2% resistance line, and the stock is a little over 5% lower from that point. The stock is very close to support at $17, and if the stock can find a stabilization point in this range, it could set up a nice ABC pullback pattern. A break above $18 would confirm the stock’s short-term upward trend and should provide a good basis for continued bullish momentum up to about $20, as shown by the 61.8% retracement line. A drop below support at $17 should see the stock retest its trend lows between $15 and $15.50 per share.
Near-term Keys: If you’re looking for a short-term, bullish trade, look for a break above resistance at $18 as a good signal to buy the stock or to work with call options, with a target price to exit the trade at around $20 per share. If the stock shows weakness, and pushes below its immediate support at $17, consider shorting the stock or working with put options, with an eye on the trend low around $15. The stock’s value proposition is interesting, and could even be taken as compelling; a push above $20 could significantly increase the chances the stock could retest its 52-week highs around $24 in the long term.