For the last week or so, I’ve been focusing a lot of attention and analysis on the Food Products industry in the Consumer Staples sector. A lot of the stocks in this industry have increased nicely since the beginning of the year, but remain well below their 52-week highs. That’s opened up a lot of interesting value-based opportunities in this industry, as well as a few value traps. As with any potential investment, I think the best probabilities of long-term success come from looking for stocks with a good combination of fundamental strength and value.
I want to wrap up my analysis of the industry this week with a stock that is opposite end of the price performance scale than the Food stocks I’ve been focusing on. Strong fundamentals have been among the reasons Hormel Foods Corp (HRL) has managed to maintain a strong upward trend since October 2017. Like most stocks in the industry, HRL dropped off of a multi-year high around $46 in September of last year; but while a lot of other stocks plunged into near-bear-market territory, HRL only dropped to about $41 before stabilizing. Since that point, the stock hasn’t rallied very much at all; it is up only about 1.5% year-to-date.
Prepackaged food stocks like HRL, CPB, KHC have all been facing significant challenges over the last couple of years related to changing consumer preferences. HRL occupies a somewhat different niche than some of these other stocks, however because its products fit nicely into that shift towards healthier choices, with a specific emphasis on proteins. Does the fact the stock has a strong fundamental profile mean that it is also a good value? Let’s take a look.
Fundamental and Value Profile
Hormel Foods Corporation is engaged in the production of a range of meat and food products. The Company operates through four segments: Grocery Products, which is engaged in the processing, marketing and sale of shelf-stable food products sold for the retail market and health and also consists of nutrition products, including Muscle Milk protein products.; Refrigerated Foods, which consists of the processing, marketing and sale of branded and unbranded pork, beef, chicken and turkey products for retail, foodservice and fresh product customers; Jennie-O Turkey Store (JOTS), which consists of the processing, marketing and sale of branded and unbranded turkey products for retail, foodservice and fresh product customers; and International & Other, which includes Hormel Foods International Corporation, which manufactures, markets and sells the Company products internationally. HRL’s market cap is about $23.2 billion.
Earnings and Sales Growth: Over the last twelve months, earnings were flat, while sales were somewhat positive at 1.25%. In the last quarter, both earnings and revenues declined, at -13.7% and -6.5%, respectively. The company’s margin profile is quite impressive when compared to a lot of other stocks in the industry. Over the last twelve months, Net Income was 9.92%, and increased somewhat to 10.22% in the most recent quarter.
Free Cash Flow: HRL’s free cash flow was a little over $861 million over the past twelve months and translates to a Free Cash Flow Yield of just 3.75%.
Dividend Yield: HRL’s dividend is $.84 per share, and translate to an attractive yield of 1.93% at its current price.
Debt to Equity: HRL has a debt/equity ratio of .04. This is a very low number that is clearly representative of the company’s conservative use of leverage and its approach to debt management.
Price/Book Ratio: there are a lot of ways to measure how much a stock should be worth; but one of the simplest methods that I like uses the stock’s Book Value, which for HRL is $10.67 per share. That translates to a Price/Book ratio of 4.06. The stock’s historical Price/Book ratio is 4.32, which puts a long-term target price at about $45 per share. The stock’s current price is also nearly at par with its Price/Cash Flow ratio, which means that on the basis of value, it’s difficult to forecast much more upside than the stock already has.
Technical Profile
Here’s a look at the stock’s latest technical chart.
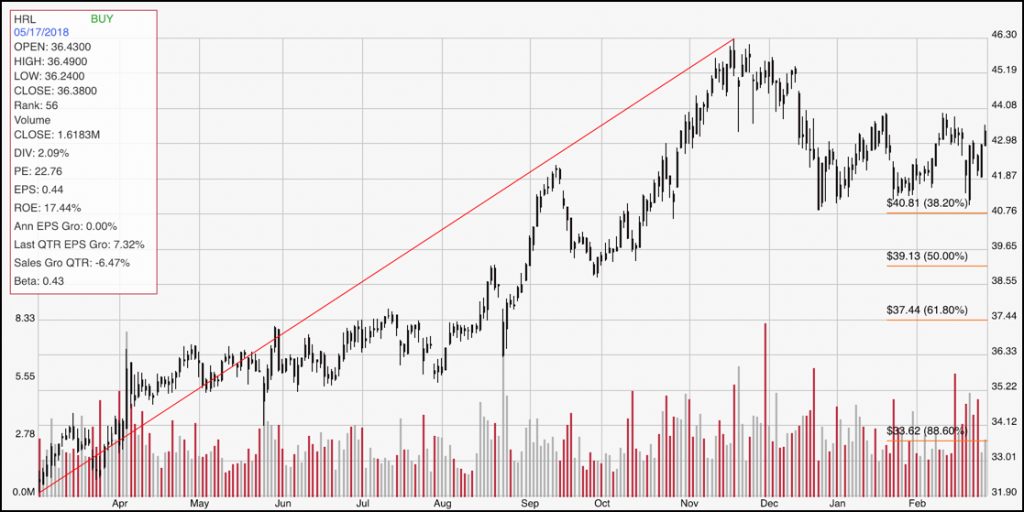
Current Price Action/Trends and Pivots: This chart traces the stock’s movement over the last year. The diagonal red line traces the stock’s upward trend; it also acts as the baseline for the Fibonacci retracement lines shown on the right side of the chart. The stock peaked at around $46 per share in November of last year before dropping to a low at about $41 in late December. From that point, the stock has established a clear consolidation pattern, with resistance at $44 and support right around the 38.2% retracement line in the $41 price area. A move past either price level would act as a strong indication of the next phase of the stock’s trend. Take a break above $44 as a signal of a continuation of the stock’s long-term bullish trend, and a drop below $41 as a bearish signal that the stock could drop even further.
Near-term Keys: HRL’s value proposition just isn’t strong enough to justify any kind of long-term bullish position right now; but the stock’s consolidation pattern does offer a couple of intriguing price setups. A break above $44 would be a strong signal to buy the stock or work with call options, with a short-term price target near the $46 high. If you don’t think that is enough upside to justify a trade, pay attention to the $46 price range. If the stock can break that level, it would establish a new multi-year high that could offer even more upside potential. A drop below $41 per share could see the stock drop as far as about $37 as shown by the 61.8% retracement line, which could offer a good opportunity to short the stock or to buy put options.