A few months ago, I wrote about the merger between pharmacy kingpin CVS Health Corporation (CVS) and healthcare insurer Aetna Inc. I decided to try to determine if the deal, which closed shortly after I wrote about it, offered a compelling reason to buy the stock at its price at the time, which at the time was near to its 52-week highs above $80 per share. Into the end of 2018, the broad market’s decline pushed the stock down near to its 52-week lows around $65. The company released its latest quarterly earnings report late last month, which provided some important initial insight about the immediate, near-term effect the merger has had.
The market didn’t take the news well; after the stock had rallied to about $70 pre-report, the stock sold off sharply, breaking below the stock’s 52-week low to a fresh, multi-year low point at the end of last week around $57.50. Among the concerns are Net Income that has turned negative and dramatically decreasing cash and increasing debt. The single greatest contributor to these results is almost certainly coming from the impact of the merger; and the truth is that the stock could see continued downside for the foreseeable future until some of these core financial results start to shift. Even so, most experts and analysts still see most of these elements as temporary that will work themselves out in the future.
One really interesting positive immediate result of the merger is the fact that the company’s intrinsic worth, as measured by Book Value per share, has nearly doubled since the quarter previous. Before February, the stock was already trading at what I considered to be very interesting valuation levels; but now those levels are even more compelling. Does the stock’s current decline and bearish momentum mean this is an opportunity a careful value-oriented investor shouldn’t pass up?
Fundamental and Value Profile
CVS Health Corporation, together with its subsidiaries, is an integrated pharmacy healthcare company. The Company provides pharmacy care for the senior community through Omnicare, Inc. (Omnicare) and Omnicare’s long-term care (LTC) operations, which include distribution of pharmaceuticals, related pharmacy consulting and other ancillary services to chronic care facilities and other care settings. It operates through three segments: Pharmacy Services, Retail/LTC and Corporate. The Pharmacy Services Segment provides a range of pharmacy benefit management (PBM) solutions to its clients. As of December 31, 2016, the Retail/LTC Segment included 9,709 retail locations (of which 7,980 were its stores that operated a pharmacy and 1,674 were its pharmacies located within Target Corporation (Target) stores), its online retail pharmacy Websites, CVS.com, Navarro.com and Onofre.com.br, 38 onsite pharmacy stores, its long-term care pharmacy operations and its retail healthcare clinics. CVS has a market cap of $81 billion. Aetna Inc. is a diversified healthcare benefits company. The Company operates through three segments: Health Care, Group Insurance and Large Case Pensions. It offers a range of traditional, voluntary and consumer-directed health insurance products and related services, including medical, pharmacy, dental, behavioral health, group life and disability plans, medical management capabilities, Medicaid healthcare management services, Medicare Advantage and Medicare Supplement plans, workers’ compensation administrative services and health information technology (HIT) products and services. The Health Care segment consists of medical, pharmacy benefit management services, dental, behavioral health and vision plans offered on both an Insured basis and an employer-funded basis, and emerging businesses products and services. The Group Insurance segment includes group life insurance and group disability products. Its products are offered on an Insured basis. AET has a market cap of $59.2 billion.
Earnings and Sales Growth: Over the last twelve months, earnings for CVS increased by about 11.5%, while sales increased 12.5%. CVS’ margin profile was narrow before the merger, but after the merger is actually negative on both a trailing twelve month and most recent quarter basis, at -.03% and -.07%, respectively.
Free Cash Flow: CVS’s free cash flow is healthy, at about $4.3 billion. This is a number that declined significantly since mid-2017, from a high at around $9.5 billion. It translates to a Free Cash Flow Yield of 7.28%.
Debt to Equity: CVS has a debt/equity ratio of 1.22. This is higher than I usually prefer to see, but is primarily attributable to the massive increase in debt the company preemptively took on at the beginning of the year when the merger was first announced. Total long-term debt is $71.4 billion, which cash and liquid assets are about $6.5 billion. By standard measurements, the company’s liquidity comes into question; however CVS has also laid out an aggressive debt reduction program that they expect to lower the total debt the combined company will be working with to much more conservative levels early in 2020. They’ve also suspended their dividend increase and share repurchase programs for the time being while they work on debt reduction.
Dividend: CVS pays an annual dividend of $2.00 per share. At the stock’s current price, that translates to an attractive dividend yield of about 3.44%.
Price/Book Ratio: there are a lot of ways to measure how much a stock should be worth; but one of the simplest methods that I like uses the stock’s Book Value, which for CVS is $57.46, which represents a boost from the last quarter, when it was at $35.97 per share. At CVS’s current price, that translates to a Price/Book ratio of 1.01. The stock’s historical average is 2.5, which suggests the stock is now nearly 150% undervalued. Projecting a long-term target above $140 is probably over-optimistic, but at the same time the stock is also more than 66% below its historical Price/Cash Flow ratio. That provides a more conservative, but still very interesting target at around $110, which is within shouting distance of the stock’s all-time highs around $115 and were last seen in mid-2015.
Technical Profile
Here’s a look at CVS’ latest technical chart.
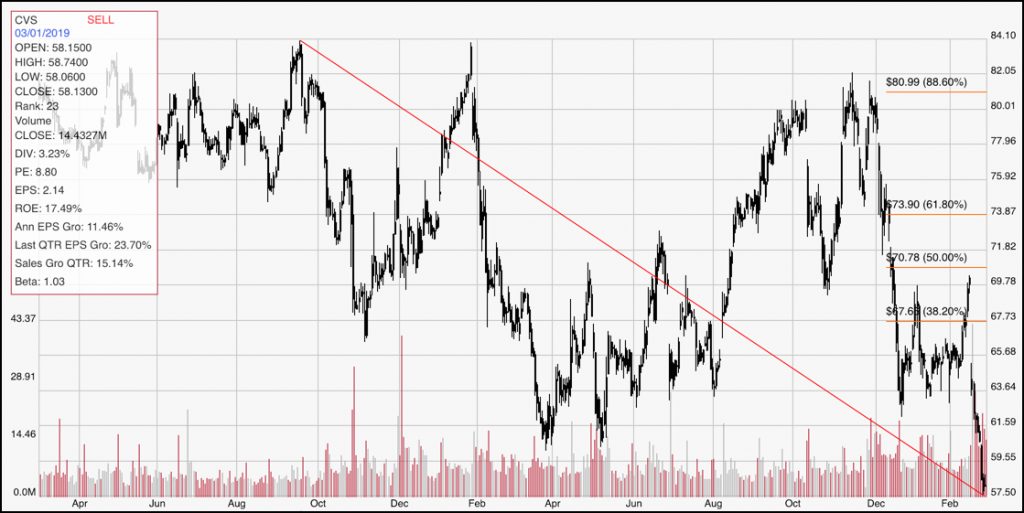
Current Price Action/Trends and Pivots: CVS’s decline following the latest earnings announcement pushed the stock quickly from about $70 to its current level a little above $58 per share. Immediate, but tenuous support is at the stock’s latest low around $57.50, with its closest and most likely resistance level around $61.50 (based on the previous set of lows in the second quarter of 2018. The stock would have to break above that resistance mark to build any kind of sustainable bullish momentum, even in the short-term given the strength of the stock’s long-term downward trend. A push above $68, where the 38.2% retracement line sits would give the stock a good basis for a longer-term upward trend.
Near-term Keys: if the stock’s bearish momentum holds, a drop below $57.50 should be taken as a signal to short the stock or start buying put options with a target around the next expected support level, which should be around $52 based on pivots last seen in the first quarter of 2013. If the stock can break above the 38.2% retracement line, its bullish momentum could be enough to push it somewhere between $71 and $73 based on both previous pivots around $71, and the 61.8% retracement line around $73. What about the value proposition? While I think the valuation numbers are compelling, I also believe the downside risk in the near term is very elevated right now because of the way the market is reacting to the initial, post-merger measurements. I think the smarter move right now, given that uncertainty is to wait until those number start to improve, including seeing significant progress in debt reduction.