One of the classic benchmark of the economy’s health and strength is the housing market. Stocks of retail companies like Home Depot (HD) and Lowe’s (LOW) often serve as proxies of to guide the market’s perception of the housing market, but it also isn’t uncommon to see experts and analysts referring to homebuilders like D.R. Horton (DHI) and Toll Brothers (TOL) in the same way. Throughout almost all of last year, homebuilding stocks underperformed the broad market, but since that point the sector has followed the pattern of most of the rest of the market higher.
Another interesting segment of the Homebuilding industry, by extension of healthy demand in both new and existing housing over the past few months, is in homebuilding suppliers. Owens Corning (OC) is a leader in the Building Products sub-industry. Since the beginning of the year, the stock has increased in value by a little over 10%, but over the past twelve months remains more than 38% lower.
Besides the fact that the stock is significantly below its all-time high price, there are some interesting fundamental reasons to believe the stock is trading at a significant discount right now to where it could be. There is also an interesting argument that if the economy continues to be healthy through this year and into 2020 as many experts expect, housing demand should continue to be healthy, which should give the stock a much greater chance to build even further on the strength it has already built. The problem, however is that sometimes stocks get depressed, and establish new 52-week lows for good reasons that investors would be wise to pay attention to. Besides some legitimate strengths, there are also signs that everything is not as good as it could be, and the company could encounter greater problems if a shift in the economy comes sooner than later. Let’s take a look.
Fundamental and Value Profile
Owens Corning is engaged in the business of composite and building materials systems, delivering a range of products and services. The Company’s products range from glass fiber used to reinforce composite materials for transportation, electronics, marine, infrastructure, wind-energy and other markets to insulation and roofing for residential, commercial and industrial applications. The Company’s segments include Composites, Insulation and Roofing. The Composites segment sells glass fiber and/or glass mat directly to a small number of shingle manufacturers. Its insulating products include thermal and acoustical batts, loosefill insulation, foam sheathing and accessories, and these are sold under brand names, such as Owens Corning PINK FIBERGLAS Insulation. The primary products in the Roofing segment are laminate and strip asphalt roofing shingles. Its other products include oxidized asphalt, roofing components and synthetic packaging materials. OC has a current market cap of about $5.3 billion.
Earnings and Sales Growth: Over the last twelve months, earnings increased by 24%, while revenues grew more than 7%. On a quarterly basis the numbers turned negative; earnings declined -10% while sales dropped by -5%. That’s problematic because it is a sign the company is becoming less efficient. A counter to this argument comes from the company’s margin profile; Net Income as a percentage of Revenues is healthy, and has improved in the last quarter versus the trailing twelve months from 7.72% to 9.9%.
Free Cash Flow: OC’s free cash flow is adequate, at $293 million, but it has also declined since the beginning of 2018 from a high at $682 million.
Dividend: OC’s annual divided is $.88 per share, which translates to a yield of 1.8% at the stock’s current price.
Price/Book Ratio: there are a lot of ways to measure how much a stock should be worth; but one of the simplest methods that I like uses the stock’s Book Value, which for OC is $39.46 and translates to a Price/Book ratio of 1.23 at the stock’s current price. The stock’s historical average Price/Book ratio is 1.675, which puts a target price for the stock at about $66 per share. That is more than 35% above the stock’s current price, and looks very compelling. The stock is also about 52% below its Price/Cash Flow ratio, which provides a higher target price around $74 per share.
Technical Profile
Here’s a look at the stock’s latest technical chart.
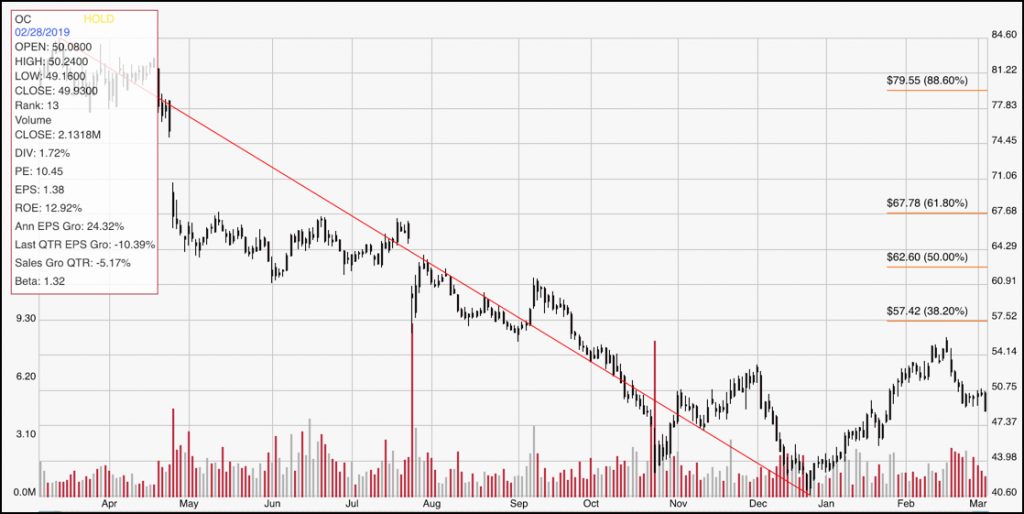
Current Price Action/Trends and Pivots: The red diagonal line measures the length of the stock’s long-term downward trend until the end of 2018; it also informs the Fibonacci trend retracement lines shown on the right side of the chart. After rallying off of the trend low in late December and nearly to the 38.2% retracement line around $56, the stock has retraced a bit, which is helping the stock start to form a nice ABC stair-step pattern. If the stock can find support and pivot higher, a break the 38.2% retracement line, to $58 could provide some strong short-term upside to about $67 where the 61.8% retracement line sits. A break below $47 could see the stock drop to as low as around $40 per share at the stock’s 52-week low.
Near-term Keys: Watch the stock’s activity from this point. You can take a drop below $47 as a sign that the stock’s nearest support level isn’t holding, which could provide a strong signal to short the stock or start working with put options with a target price around $40. The best signal for a bullish trade would come from a break above $57.50; if you want to be a little more speculative, you could use a pivot off of support as an opportunity to trade the distance between support at around $47 to $57. The stock does have a compelling value argument right now; however I would prefer to see the company reverse its pattern of declining Free Cash Flow before I start to look for a long-term opportunity on that basis.