The market has been nervous this week – whether you want to cite trade war fatigue, global economic fears that could be rippling into U.S. economic metrics, or earnings reports from some of the market’s biggest companies that have disappointed investors. I think it’s true that tariffs between the U.S. and its biggest trading partners (not just China) have had a negative effect – in China, and in Europe most notably. That is a factor that should absolutely be expected to affect U.S. multinationals, which means that some of the disappointing earnings results we’ve seen in the last couple of weeks really shouldn’t be a very big surprise.
It’s also true since the beginning of the year, the broad market has rebounded strongly from its near-bear market correction at the end of 2018. As of yesterday’s close, the S&P 500 is up about 11%, and is only now seeing a break in the bullish momentum that pushed it to that point. I saw a report earlier this week that referred to the rally as a “bear market rally” and suggested that investors shouldn’t buy into the hype that the market could go higher. I think it’s still a little premature to call for a bear market, especially since even at their December lows, none of the major market indices actually entered official bear market territory.
The other reason I’m not so sure that the outlook is all that bad, is because three critical U.S. economic metrics remain positive, with good chances they’re going to stay that way. First, the Fed has indicated that they’ll be patient about making any changes to interest rates this year; a more accommodative Fed policy is clearly aimed at sustaining current economic strength in the U.S. Employment remains very strong, and income is still healthy as well. All together, these are metrics that I think point to a mostly positive U.S. outlook for the year and into 2020.
One industry that really keys off of these three same metrics is Household Durables. That includes homebuilders like Toll Brothers Inc. (TOL), one of the biggest U.S. homebuilders with a national footprint. I think it’s smart right now to put more emphasis on stocks that have solid fundamental strength, and that still carry a nice value proposition even with the current surge in bullish momentum. If some of the bearish sentiment of this week does carry over in the near-term, we could see the market retrace its rally a bit further; but that could just carry a new opportunity to work with the kinds of stocks I like at even better valuation levels.
Fundamental and Value Profile
Toll Brothers, Inc. is engaged in designing, building, marketing, selling and arranging financing for detached and attached homes in luxury residential communities. The Company operates through two segments: Traditional Home Building and Toll Brothers City Living (City Living). Within the Traditional Home Building segment, it operates in five geographic segments in the United States: the North, consisting of Connecticut, Illinois, Massachusetts, Michigan, Minnesota, New Jersey and New York; the Mid-Atlantic, consisting of Delaware, Maryland, Pennsylvania and Virginia; the South, consisting of Florida, North Carolina and Texas; the West, consisting of Arizona, Colorado, Nevada and Washington, and California. City Living is the Company’s urban development division. Its products include Traditional Home Building Product and City Living Product. Its Traditional Home Building Product includes detached homes, move-up, executive, estate, and active-adult and age-qualified lines of home. TOL has a current market cap of about $5.3 billion.
Earnings and Sales Growth: Over the last twelve months, earnings increased by almost 78%, while revenues grew 21%. The numbers remain very positive on a quarterly basis, too – earnings improved 65% while sales grew by 28%. Increasing earnings faster than sales is hard to do, and generally isn’t sustainable in the long-term; however it is also a positive mark of management’s ability to maximize its business operations. TOL also operates with a healthy margin profile; over the last twelve months, Net Income was 9.9% of Revenues. The number declined somewhat in the last quarter, but remains healthy at 8.2% in the last quarter.
Free Cash Flow: TOL’s free cash flow is healthy, at $574 million and translates to a very nice Free Cash Flow Yield of 11.33%.
Dividend: TOL’s annual divided is $.44 per share, which translates to a yield of 1.26% at the stock’s current price.
Price/Book Ratio: there are a lot of ways to measure how much a stock should be worth; but one of the simplest methods that I like uses the stock’s Book Value, which for TOL is $32.36 and translates to a Price/Book ratio of 1.09 at the stock’s current price. The stock’s historical average Price/Book ratio is 1.36, which puts a target price for the stock at about $44 per share. That is almost 25% above the stock’s current price, which is very attractive. The stock is also more than 50% below its historical Price/Cash Flow average.
Technical Profile
Here’s a look at the stock’s latest technical chart.
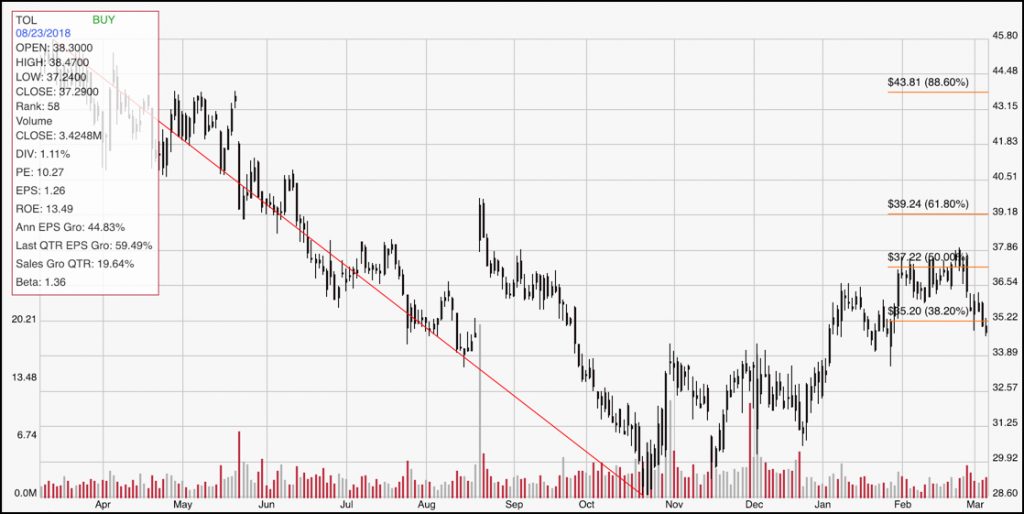
Current Price Action/Trends and Pivots: The red diagonal line measures the length of the stock’s long-term downward trend until late October; it also informs the Fibonacci trend retracement lines shown on the right side of the chart. After rallying off of that October trend low up to the 50% retracement line around $37.50, the stock has retraced a bit, and even dropped below the 38.2% line in the last couple of days. That could be setting up a nice ABC stair-step pattern, or it could mark a break below important support. If the stock can find support and pivot higher, a break back above the 38.2% retracement line, to $36 could provide some good bullish momentum. TOL would need to break above its recent pivot high around $37.50 to mark a continuation of its current intermediate-term bullish trend. Its next support point is around $34, so a break below that point could see the stock retest is October trend low around $29.
Near-term Keys: Watch the stock’s activity from this point. You can take a drop below $34 as a sign that the stock’s nearest support level isn’t holding, which could provide a strong signal to short the stock or start working with put options with a target price around $29. The best signal for a bullish trade would come from a break above $37.50, with a target near to $40 for a short-term bullish trade with call options or buying the stock. Even with the stock’s strong intermediate trend, the stock has a terrific value argument right now, with a strong balance sheet to provide a good basis for a long-term investment at this current price.