One of the things about stocks in the Consumer Discretionary sector that is interesting is how widely disparate they are. The general perception of most stocks in the sector is that they are highly cyclical, sensitive to inflationary pressures that make them more risky when the economy is in trouble. One industry in the sector that I think that logic does apply to is travel, since when economic struggles are usually reflected on the consumer level by increasing unemployment and declining wages.
Despite the market’s fears this week that global economic concerns are starting to bleed into the U.S., the fact remains that unemployment remains at historical lows at 4% – a level the Federal Reserve uses as a primary barometer of full employment. In addition, average hourly wages, which the Fed uses to gauge income growth, gained 3.2% in the last year and which the Fed expects to continue to be strong. Those are indications that should generally play to the advantage of stocks in the travel and vacation space.
Expedia Group Inc. (EXPE) is perhaps the largest most recognizable name for online travel. While the stock is significantly below its multi-year high around $160, it has managed to sustain a gradual upward trend over the past year, increasing from a little under $100 to its current level just below $125. Despite that 25% increase over the past year, the stock remains nearly 24% below its August 2017 high point. In addition, my favorite valuation measurements indicate the stock remains significantly undervalued right now. Is the company’s fundamental strength good enough to justify thinking about taking on a new position? Take a look and decide for yourself.
Fundamental and Value Profile
Expedia Group, Inc., formerly Expedia, Inc., is an online travel company. The Company operates through four segments: Core Online Travel Agencies (Core OTA), trivago, Egencia and HomeAway. The Company’s Core OTA segment provides a range of travel and advertising services to its customers across the world, through a range of brands, including Expedia.com and Hotels.com in the United States, and localized Expedia and Hotels.com Websites throughout the world, Orbitz.com, Expedia Affiliate Network, Hotwire.com, Travelocity, Wotif Group, CarRentals.com and Classic Vacations. The Company’s trivago segment sends referrals to online travel companies and travel service providers from its hotel metasearch Websites. Its Egencia segment, which also includes Orbitz Worldwide (Orbitz) for Business, provides managed travel services to corporate customers across the world. The Company’s HomeAway segment operates an online marketplace for the vacation rental industry. EXPE has a current market cap of about $16.6 billion.
Earnings and Sales Growth: Over the last twelve months, earnings increased by almost 55%, while revenues grew a bit more than 10%. The pattern turned sharply negative in the last quarter, however, as earnings declined by -70.5% while sales decreased almost -22%. This dynamic is also reflected in the company’s margin profile, as Net Income over the last twelve months was a narrow 3.61%, but contracted to only about .66% in the last quarter. This appears to be a reflection, at least in part, of the reality that airlines, hotels and other travel-related businesses that have historically relied on online services like EXPE to connect their products with consumers, are continually looking for ways to connect with consumers without relying on a “middleman” service like any one of the several brands EXPE operates.
Free Cash Flow: EXPE’s free cash flow is healthy, at $1.09 billion and translates to a Free Cash Flow Yield of 5.94%.
Dividend: EXPE’s annual divided is $1.28 per share, which translates to a yield of about 1.02% at the stock’s current price.
Price/Book Ratio: there are a lot of ways to measure how much a stock should be worth; but one of the simplest methods that I like uses the stock’s Book Value, which for EXPE is $38.39 and translates to a Price/Book ratio of 3.2 at the stock’s current price. The stock’s historical average Price/Book ratio is 5.14, which puts a target price for the stock at about $197 per share. That is almost 60% above the stock’s current price, but since that is more than $35 above the stock’s multi-year high around $160. The stock offers a more conservative, but attainable target using its Price/Cash Flow ratio, which is about 18.5% below its historical average.
Technical Profile
Here’s a look at the stock’s latest technical chart.
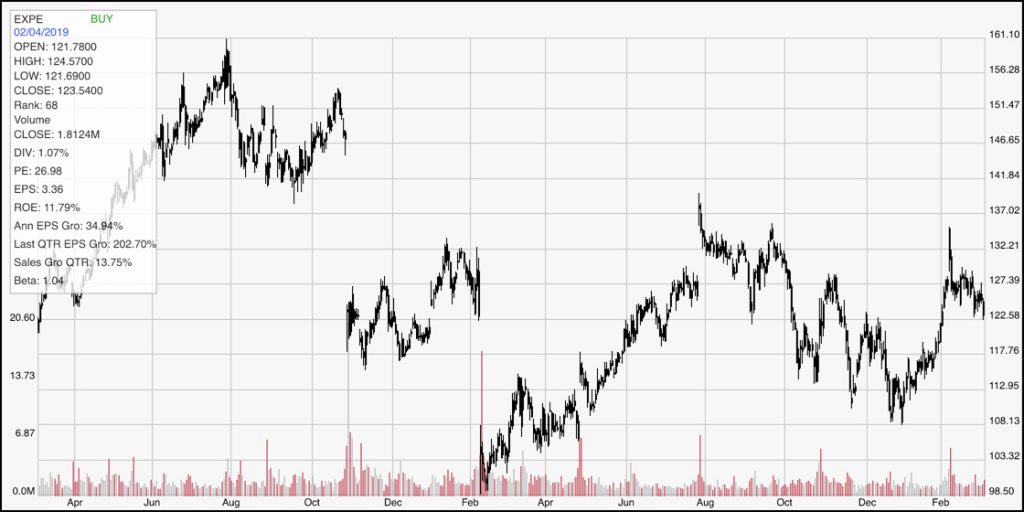
Current Price Action/Trends and Pivots: The chart above covers the last two years of price activity, and is useful because it displays both the stock’s high around $160 in August 2017 as well as its low around $98 in February of last year. Despite retracing about 14% in the last quarter of 2018, the stock has rallied with the rest of the market by almost the same amount. In the last month, the stock’s bullish momentum has faded, dropping off of pivot high resistance at round $132 to its current level. The stock appears to be sitting right at its most immediately support level at $123. It would need to break above $132 to maintain its upward trend since the beginning of the year; a break below support at $123 could easily see the stock drop to around the $108 to $113 level, which is where the the stock last significant pivot low occurred.
Near-term Keys: A drop below $123 could be a strong signal to short the stock or buy put options with an eye on $113 as a target price. The stock would need to rally about $10 higher from its current price to offer a short-term bullish trade with any kind of reasonable probability to justify buying the stock or working with call options. The stock’s value proposition is interesting, but not quite compelling given the fact that Net Income appears to be deteriorating. I would prefer to see that pattern turn back to the positive side before taking any kind of long-term position.