One of the classic benchmarks of the economy’s health and strength is the housing market. Stocks of retail companies like Home Depot (HD) and Lowe’s (LOW) often serve as proxies of to guide the market’s perception of the housing market, but it also isn’t uncommon to see experts and analysts referring to homebuilders like D.R. Horton (DHI) and Toll Brothers (TOL) in the same way. Throughout almost all of last year, homebuilding stocks underperformed the broad market, but since that point the sector has followed the pattern of most of the rest of the market higher.
Recent reports from the sector indicate that there are some important elements that could help homebuilders increase sales and profits this year and into 2020; high employment and rising income levels, for example generally imply that more consumers should be able to purchase homes, either as first-time home buyers or to upgrade from the homes they are in. Other reports, however are more mixed; for example, while new home sales have shown solid improvement since October of last year, they are also marginally lower versus the same period a year ago. Analyst projections seem to be just as mixed, with some forecasting modest, but useful improvements for the industry this year, and others expecting the market for new and existing homes to continue to soften.
Which is correct? That remains to be seen; but I do think that this is an interesting sector to follow for a number of reasons. Home sales can act as a leading indicator of strength or weakness at the extremes of economic cycles, and there is certainly an argument to be made for the extended state of the economy, now 10 years past the end of the recession in March of 2009. It is also worth pointing out, however, that there is no guarantee that the year-over-year decline in home sales is an indicator of economic weakness right now. No matter how they disagree, I see a lot of analysts pointing to sales in the coming spring quarter as an important litmus test for the industry now and ostensibly for the entire economy looking ahead.
One of the stocks in this industry that I’ve followed for quite some time is KB Home (KBH), a small-cap homebuilder with a footprint throughout much, but not all of the United States. They specialize in homes for first-time home buyers as well as those looking to move up from their current home. Since the first quarter of 2018, the stock has seriously underperformed the rest of the stock market, declining from a high in February 2018 at about $38 to a low around $17 in November of last year. The stock has improved noticeably from that point, however and is in the midst of an intermediate-term upward trend. The natural question at this point, of course is whether that trend will continue; from the standpoint of long-term opportunity, I think it also makes sense to ask whether the company’s fundamental strength supports a higher price, and whether the stock’s current price offer a useful value. Let’s dive in.
Fundamental and Value Profile
KB HOME is a homebuilding company. The Company is engaged in selling and building a range of new homes designed primarily for first-time, move-up and active adult homebuyers, including attached and detached single-family residential homes. It operates through five segments, which consist of four homebuilding segments and one financial services segment. Its homebuilding segments include West Coast, Southwest, Central and Southeast. The homebuilding segments are engaged in the acquisition and development of land primarily for residential purposes. The financial services segment offers property and casualty insurance and, in certain instances, earthquake, flood and personal property insurance to its homebuyers in the same markets as its homebuilding segments, and provides title services in the majority of markets located within its Central and Southeast homebuilding segments. It offers homes in development communities, at urban in-fill locations and as part of mixed-use projects. KBH has a current market cap of about $2.0 billion.
Earnings and Sales Growth: Over the last twelve months, earnings increased by a little over 14%, while revenues declined almost -4%. On a quarterly basis, earnings and sales both improved by 10%. Over the last twelve months, the company’s margin profile was very narrow, with Net Income as a percentage of Revenues at just about 3.75%. The number improved significantly in the last quarter to about 7.18%.
Free Cash Flow: KBH’s free cash flow is generally healthy, at $214 million, despite its decline from about $551 million in the 2nd quarter of last year. The stock has an attractive Free Cash Flow Yield of 10.5%.
Debt to Equity: The stock’s current debt/equity ratio is .99, which is higher than it has been historically, but is generally considered manageable. The company’s balance indicates cash and liquid assets are around $574 million as of the most recent quarter, versus about $1.4 billion of long-term debt. The company’s margin profile, along with their generally solid balance sheet indicates they should have no problem servicing the debt they carry.
Dividend: KBH’s annual divided is $.10 per share, which translates to a very modest yield of about .43% at the stock’s current price.
Price/Book Ratio: there are a lot of ways to measure how much a stock should be worth; but one of the simplest methods that I like uses the stock’s Book Value, which for KBH is $23.62 and translates to a Price/Book ratio of .99 at the stock’s current price. The stock’s historical average Price/Book ratio is 1.3, which puts a target price for the stock at almost $31 per share. That is 30% above the stock’s current price, and looks very compelling. The stock is also about 30% below its Price/Cash Flow ratio, which validates the price target I just mentioned at $31 per share.
Technical Profile
Here’s a look at the stock’s latest technical chart.
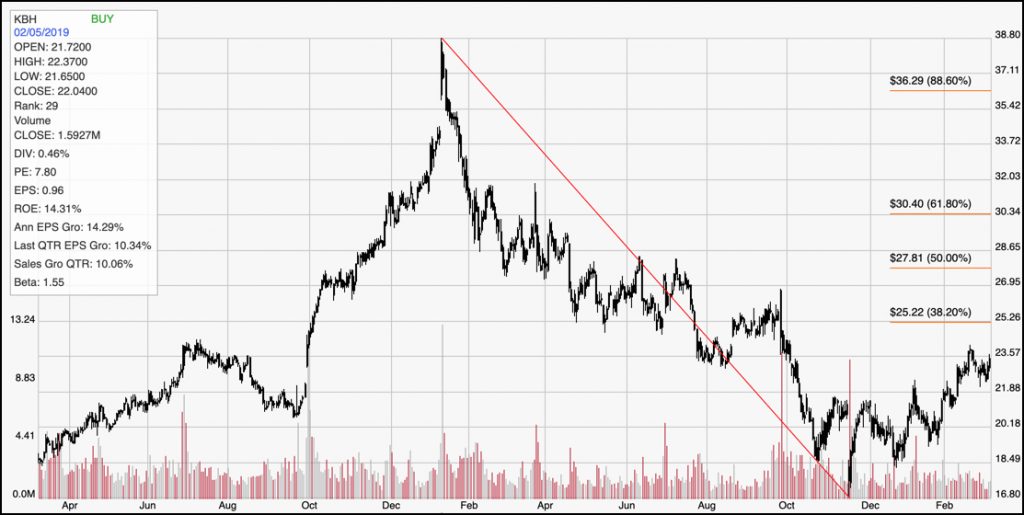
Current Price Action/Trends and Pivots: The red diagonal line measures the length of the stock’s long-term downward trend until November of 2018; it also informs the Fibonacci trend retracement lines shown on the right side of the chart. The stock has rallied nicely from that trend low to its current level a bit below $24, with immediate resistance at the 38.2% retracement line a bit above $25. The stock would need to break above that level, to about $26 to provide an ideal signal, with room to rally to the 61.8% retracement line at around $30.50. The stock’s current support level is around $22 based on previous pivot levels; a drop below that price could see the stock retest its trend lows around $17.
Near-term Keys: In the near term, I think there is a greater chance the stock could break below its current support than there is that it will maintain its current short-term bullish strength. You can take a drop below $22 as a sign that the stock’s nearest support level isn’t holding, which could provide a strong signal to short the stock or start working with put options with a target price around $17. The best signal for a bullish trade would come from a break above $25, with a target for a call options trade, or stock buy at around $30, which is also about where I put the stock’s value-based long-term price target.