Yesterday I wrote about the biggest oil services and equipment provider in the United States. A lot of stocks in the energy sector, and oil specifically, have mostly underperformed the rest of the market this year, and I think that could provide an interesting opportunity for the attentive – and patient – investor.
Because most energy stocks are highly sensitive to the movement of oil prices, they tend to carry a higher level of volatility that some long-term investors are uncomfortable with. I can understand that, because wide swings in price can make it difficult to maintain objectivity in making good investment decisions. That’s one of the reasons that I think it’s so important in this industry to pay attention to the bigger players who have the financial resources and fundamental strength to weather the those sometimes big swings in price. When you can identify not only the biggest players in a respective segment of the industry, but also those that have a proven track record of financial discipline and conservative management, you can usually find better opportunities to take advantage of an industry that remains largely discounted right now than you can get by watching the industries and sectors that everybody else is watching.
One of the biggest companies in the Oil Exploration and Production space is EOG Resources, Inc. (EOG). Unless you’re an industry insider, you might not have heard much about them, but the fact is that this is a company that has been around for decades, with major holdings in many of the biggest and most productive oil fields in the United States, including the Permian Basin, Eagle Ford, and areas in the Rockies, including Canada, as well as an international scale with production areas in the Republic of Trinidad and Tobago, the United Kingdom, and even in China. The stock is down about 35% from its high in October of last year around $133, and in the last few weeks has dropped off of resistance around $100. It appears to be building an interesting consolidation base, however that could offer investors an interesting opportunity to start thinking about using the stock as a useful long-term position. When you add to the mix a fundamental profile that is among the strongest in the Oil & Gas industry, and a value proposition that is at least equal to the size of the stock’s discount from its highs, you have a stock that you would be smart to pay more attention to.
Fundamental and Value Profile
EOG Resources, Inc. explores for, develops, produces and markets crude oil and natural gas in major producing basins in the United States, The Republic of Trinidad and Tobago, the United Kingdom, The People’s Republic of China, Canada and, from time to time, select other international areas. Its operations are all crude oil and natural gas exploration and production related. As of December 31, 2016, its total estimated net proved reserves were over 2,147 million barrels of oil equivalent (MMBoe), of which over 1178 million barrels (MMBbl) were crude oil and condensate reserves, over 416 MMBbl were natural gas liquids reserves and over 3318 billion cubic feet, or 553 MMBoe, were natural gas reserves. Its operations are focused in the productive basins in the United States with a focus on crude oil and, to a lesser extent, liquids-rich natural gas plays. It has operations offshore Trinidad, in the United Kingdom East Irish Sea, in the China Sichuan Basin and in Canada. EOG has a current market cap of about $50.5 billion.
Earnings and Sales Growth: Over the last twelve months, earnings increased by nearly 80%, while revenues grew by almost 37%. The the last quarter was rougher, as earnings declined by -29% while sales decreased -4.33%. Despite the negative earnings pattern in the last quarter, the company’s margin profile is both very strong, but also stable; in the both the last twelve months and the last quarter, Net Income was about 19.5% of Revenues, indicating the company has a very healthy operating model.
Free Cash Flow: EOG’s free cash flow is adequate, at $1.9 billion. That translates to a Free Cash Flow Yield of 3.83% that is unremarkable at first blush. Keep in mind, however that at the beginning of 2018, Free Cash Flow was only about $500 million, and has grown in each of the last four quarters.
Debt to Equity: EOG’s debt to equity is .27, indicating the company follows a pretty conservative, disciplined approach to debt management. Their balance sheet shows $1.55 billion in cash and liquid assets versus about $5.1 billion in long-term debt in the last quarter. Both of these number show positive patterns, with cash increasing from about $800 million in the second quarter of 2018, and debt decreasing from more than $6 billion in the same quarter. Along with their strong operating profile, there is little concern about the company’s ability to service their debt and maintain healthy liquidity.
Dividend: EOG’s annual divided is $.88 per share, which translates to a yield of about 1% at the stock’s current price.
Price/Book Ratio: there are a lot of ways to measure how much a stock should be worth; but one of the simplest methods that I like uses the stock’s Book Value, which for EOG is $33.39 and translates to a Price/Book ratio of 2.6 at the stock’s current price. The stock’s historical average Price/Book ratio is 3.56, which puts a target price for the stock at about $118 per share. That is a little more than 36% above the stock’s current price, which is very attractive. The stock is also trading more than 50% below its historical Price/Cash Flow ratios, which puts the stock’s long-term target well in range of its 2018 highs around $133, or possibly even above it in a best-case scenario.
Technical Profile
Here’s a look at the stock’s latest technical chart.
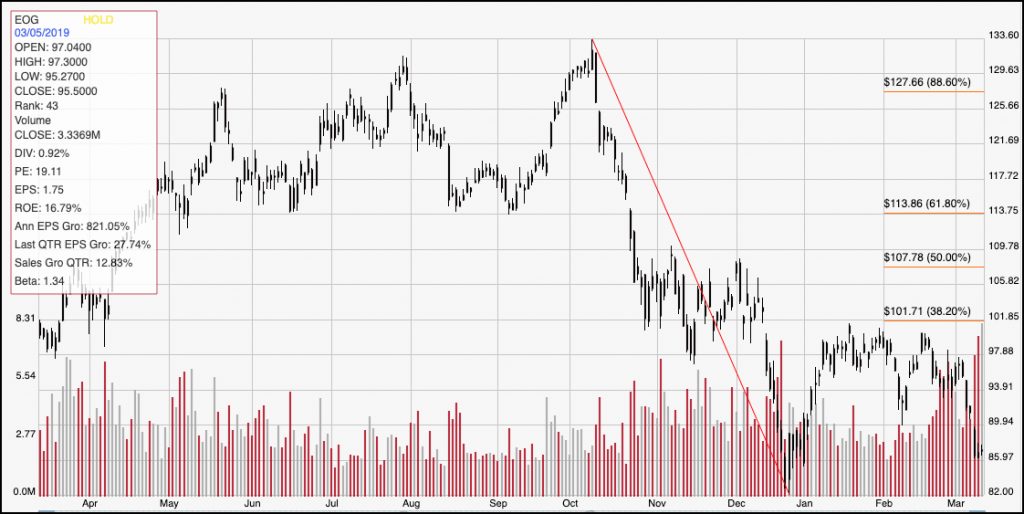
Current Price Action/Trends and Pivots: The chart above covers the last year of price activity. The red diagonal line traces the stock’s downward trend from October 2018 to its bottom in December of last year. That line also informs the Fibonacci retracement lines shown on the right side of the chart. After rallying to about $100 at the beginning of the year, the stock has dropped off of that resistance level (which can also be seen using the 38.2% Fibonacci retracement line). More recently, the stock broke below support at around $90 per share, with bearish momentum that could see the stock retest its low support at around $82 per share. The consolidation pattern I mentioned at the beginning of today’s post lies in the distance between trend low support and resistance around $100; a break above that and the 38.2% Fib line, to about $102 would mark a new upward trend for the stock that should give it strong momentum to drive close to the $113 level marked by the 61.8% Fib line. A break below support would reconfirm the downward trend the stock started at the end of last year, with room to keep dropping below $70 and near lows last seen in early 2016.
Near-term Keys: If you’re interested in trying to use EOG for a short-term trade, look for a pivot low anywhere from the stock’s 52-week low at $82 and its current price. That could offer an opportunity place a momentum-based trade and use the fairly wide distance between that low and resistance at $100 for a bullish trade, either by buying the stock or using call options. A strong bearish set up would come from a break below $82; shorting the stock, or buying put options in that case would probably be smart, with an eye on $70 as a target price. Even through the stock does have a fairly high short-term risk of dropping below that support, I think the stock’s fundamentals, and value proposition are very compelling. If you’re not afraid of a little volatility, this could be an excellent long-term opportunity.