One of the biggest drivers of the global economy is energy. That shouldn’t really come as too big a surprise, since energy products – natural gas, electricity, and oil – are a part of virtually every aspect of every sector. Oil in particular is a commodity that has a ripple effect throughout such a diverse range of industries and businesses that it is a foolish investor that doesn’t try to pay attention to what oil prices are doing.
After bottoming in early 2016, the price of oil began a steady climb higher until the latter part of 2018. West Texas Intermediate Crude – the benchmark for crude produced in the United States – for example, set a multiyear low price in January 2016 at around $28 per barrel, and then climbed to a high above $76 per barrel in November of last year. Brent crude, which is produced throughout the rest of the world, but primarily from member countries of the OPEC cartel in the Middle East, followed a similar pattern, climbing from a low at around $27 per barrel, but peaking above $86 in October. Both types of crude then dropped to around $42 (WTI) and $50 per barrel (Brent) late the year, but have rallied from that point since, with WTI now a little below $58 and Brent a bit above $67 as of this writing.
Economists and analysts like to try to forecast the direction of commodities that are likely to have an impact on the finished goods produced by other sectors and industries. That makes sense, because an increase in price for a commodity that contributes to that finished product increases the costs the manufacturer of that product must incur. Another element that I think is interesting is the difference (also called the spread) in price between similar commodities, like Brent crude versus WTI crude. The U.S. actually imports more oil from outside the U.S. than it uses its own supply, which means that changes in the spread can also have a direct impact on those finished goods.
Oil refining is an industry where that spread makes a big difference in the ability of U.S. refineries to be profitable. A wider spread usually works in favor, since they can get U.S. crude at a bigger discount than they can from overseas. In 2016 when both commodities bottomed, that spread was practically zero, which was one of the dynamics that challenged refinery stocks. The spread started to widen in mid-2017, however and has been running between $8 to $10 per barrel pretty consistently since that time. That’s pretty good news right now for refiners, especially for the biggest players like Marathon Petroleum Corp (MPC), who actively use both Brent and WTI crude to differing extents. MPC stock, however has significantly underperformed the rest of the market, however this year, and is only up about 1.5% since January. It is well off of its 2018 high price at about $88 per share, trading right around $60 right now. Does that make the stock a good buy right now? Check it out.
Fundamental and Value Profile
Marathon Petroleum Corporation is engaged in refining, marketing, retail and transportation businesses in the United States and the largest east of the Mississippi. The Company operates through three segments: Refining & Marketing; Speedway; and Midstream. The Refining & Marketing segment refines crude oil and other feedstocks at the Company’s seven refineries in the Gulf Coast and Midwest regions of the United States. Its Speedway segment sells transportation fuels and convenience products in the retail market in the Midwest, East Coast and Southeast regions of the United States. The Company’s Midstream is engaged in the operations of MPLX LP and certain other related operations. It gathers, processes and transports natural gas, natural gas liquids (NGLs), crude oil and refined products. MPLX is a limited partnership which owns, operates, develops and acquires midstream energy infrastructure assets. MPC has a current market cap of about $40.2 billion.
Earnings and Sales Growth: Over the last twelve months, earnings increased by more than 129%, while revenues grew by a little over 53%. The the last quarter, earnings improved almost 42% while sales increased nearly 41%. The company’s margin profile is very narrow, with Net Income as a percentage of Revenues in the last quarter at 2.94% and 2.94% over the last twelve months.
Free Cash Flow: MPC’s free cash flow is adequate, at $2.6 billion. That translates to a Free Cash Flow Yield of 6.4%. It is worth noting that Free Cash Flow has declined from $3.56 billion in the last quarter but improved from $1.4 billion a year ago.
Debt to Equity: MPC’s debt to equity is .61, which is generally considered a conservative number. The company’s balance sheet indicates operating profits should be adequate to service their debt, but it also indicates the company’s liquidity is decreasing – about $1.7 billion in the last quarter versus more than $5 billion in the third quarter of 2018 – while debt is increasing. Long-term debt was $26.9 billion in the last quarter versus $18.4 billion in the quarter prior. At least a portion of this aspect can be explained by MPC’s acquisition in October of last year of competitor Andeavor for $23 billion in cash and stock.
Dividend: MPC’s annual divided is $2.12 per share, which translates to a yield of about 3.55% at the stock’s current price.
Price/Book Ratio: there are a lot of ways to measure how much a stock should be worth; but one of the simplest methods that I like uses the stock’s Book Value, which for MPC is $63.76. That’s not a typo; until the most recent quarter the stock’s Book Value was 0. That means that the stock’s Price/Book ratio is .94. Their historical Price/Book ratio is 2.32, which suggests that the stock is undervalued by more than 50% right now. By contrast, however the stock is actually trading about 16% above its historical Price/Cash Flow ratio.
Technical Profile
Here’s a look at the stock’s latest technical chart.
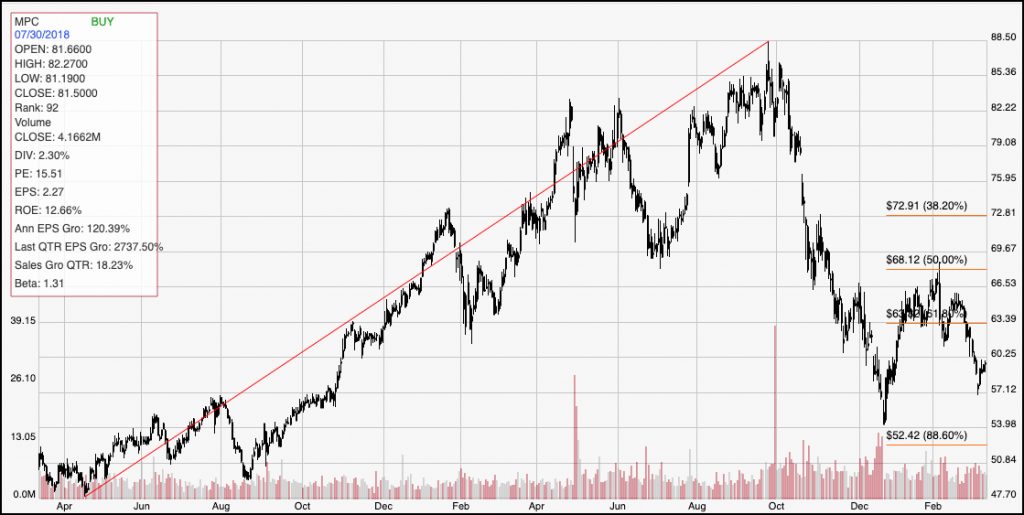
Current Price Action/Trends and Pivots: The chart above covers the last two years of price activity. The red diagonal line traces the stock’s upward trend to its peak in September at around $88.50. That line also informs the Fibonacci retracement lines shown on the right side of the chart. After rallying from a low around $54, and near the 88.6% retracement line, the stock peaked at the beginning of February at around $66.53, before dropping back to its current level. The stock’s closest resistance is at the 61.8% retracement line, at about $63 per share. The stock would need to break above its February peak to mark the beginning of a new upward trend. If that happens, the stock should be able to rally to somewhere between $70 and $72 per share, based on previous pivots as well as the 38.2% retracement line.
Near-term Keys: If you work off of the basis of the stock’s Price/Book ratio, MPC carries a compelling value argument. Project a long-term target price above $145 per share is over-optimistic in my view, given that the stock’s all-time high was reached in September of last year; however that peak does offer an interesting opportunity if you’re willing to be patient. From a short-term standpoint, a break above the 61.8% retracement line could offer an interesting short-term bullish trade using the stock itself or call options, with a short-term target at around $68 per share. A push below $54 should see the stock test its 52-week low point around $48, which could offer a useful opportunity to short the stock or to buy put options.