Over the last several years, one of the biggest benchmarks the Fed has used to evaluate the need to raise, lower or maintain their interest rate policy has been the employment rate. Every month, the market seems to hold its breath as a new set of unemployment and salary data is made available and everybody gets to wonder what the information means for the current economic climate and, therefore, for interest rates. The market has used Fed comments at the end of last year that seemed more and more dovish about the pace and timing of future rate increases as part of the motivation to drive the market off of near-bear market lows and into a nice little rally so far this year.
We’re moving into the tenth year of an economic expansion that is unprecedented in recorded U.S. history. That generally means that U.S. business is healthy, profitable, and growing. That generally also means that there are plentiful jobs to be hand for anybody that might be looking for work, or possibly for a new, better opportunity. That also means that businesses that offer services that can help match job talent with workforce needs, on either a temporary or long-term basis, often do well. And that’s where today’s stock comes into play. ManpowerGroup Inc. (MAN) is one of the largest providers of workforce solutions and services, with operations that span the globe. Most economic forecasts, including those coming from the Fed, seem to indicate that employment growth should remain strong, with demand high in particular for talent in highly skilled technical and professional occupations. That supports the idea that demand for staffing services such as those provided by MAN should remain healthy.
There are some risks; outside the U.S., economic growth is slowing, and in Europe, which is where MAN derives more than 2/3 of its revenue, those numbers look like they could be turning negative. The unknowns about Brexit, which have yet to be resolved, seem to be weighing on the entire European Union as well as Great Britain, as well as the effects of tariffs and trade tensions. Economic downturns tend to be strongly negative for a company like MAN, and so this could be a significant headwind looking ahead. That said, MAN is also a stock with an excellent fundamental profile by most measurements, and a value proposition that remains pretty interesting. Should you consider taking a position right now? Let’s take a look.
Fundamental and Value Profile
ManpowerGroup Inc. is a provider of workforce solutions and services. The Company’s segments include Americas, Southern Europe, Northern Europe, Asia Pacific Middle East (APME), Right Management and Corporate. The Company’s Americas segment includes operations in the United States and Other Americas. Its Southern Europe segment includes operations in France, Italy and Other Southern Europe. Its Northern Europe segment includes operations in the United Kingdom, the Nordics, Germany and the Netherlands. The Company’s APME operations provide a range of workforce solutions and services offered through Manpower, Experis and ManpowerGroup Solutions, including permanent, temporary and contract recruitment, assessment and selection, training and outsourcing. The Company’s Right Management segment provides talent and career management workforce solutions. The Company provides services under its Experis brand, particularly in the areas of information technology (IT), engineering and finance. MAN’s current market cap is $5.1 billion.
Earnings and Sales Growth: Over the last twelve months, earnings grew more than 15% while revenues declined a little more than -4%. In the last quarter, earnings declined by a little over -1%, while sales were down -.47%. These are signs the company is being affected y some of the global economic issues I mentioned earlier. MAN operates with a very narrow margin profile, with Net Income consistently running at only about 2.5% of Revenues over both a trailing twelve-month period as well as over the most recent quarter.
Free Cash Flow: MAN’s free cash flow is healthy, at a bit over $418 million. This is a number that declined significantly from mid-2016, when it hit a high of about $660 million to a low of about $110 million in the first quarter of 2018 before improving to the current number.
Debt to Equity: MAN has a debt/equity ratio of .38. This is a conservative number that is manageable despite its increase over the last couple of quarters from .17. The company’s balance sheet indicates that it despite its narrow margin profile, it is sufficient to service its conservative level of debt, with healthy liquidity from about $591 million in cash and liquid assets to provide additional flexibility.
Dividend: MAN pays an annual dividend of $2.02 per share, which translates to a yield of about 2.39% at the stock’s current price.
Price/Book Ratio: there are a lot of ways to measure how much a stock should be worth; but one of the simplest methods that I like uses the stock’s Book Value, which for MAN is $43.64 and translates to a Price/Book ratio of 1.73 at the stock’s current price. Their historical average Price/Book ratio is 2.24. That suggests the stock is trading right now at a discount of about 15%, which puts the stock’s long-term target at a little below $98 per share. More interesting is the fact that the stock is currently trading more than 69% below its historical Price/Cash Flow ratio. The stock’s all-time high was reached in early 2017 at about $137 per share, which means that a rally to par with the stock’s historical average Price/Cash Flow ratio puts that high in range over the long term.
Technical Profile
Here’s a look at the stock’s latest technical chart.
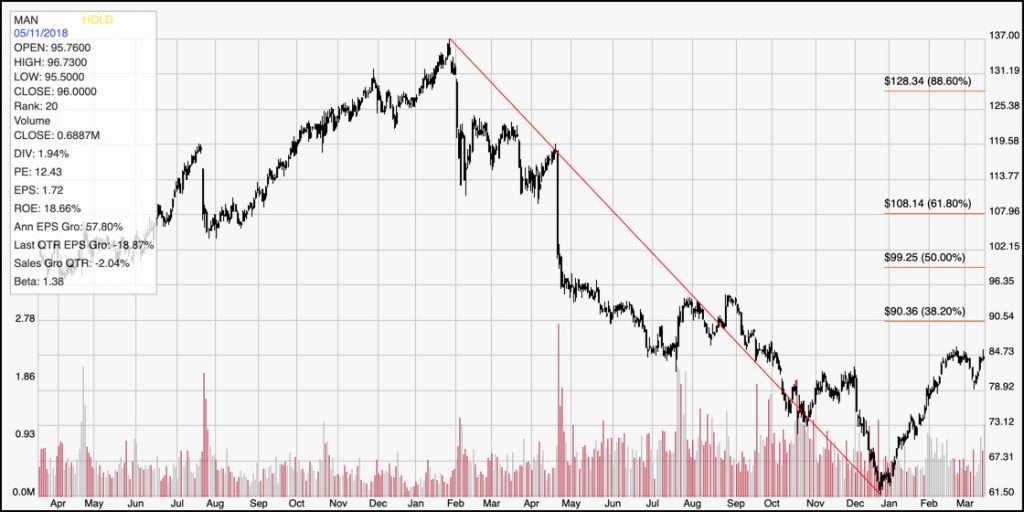
Current Price Action/Trends and Pivots: The red diagonal line measures the length of the stock’s downward trend from late January to its bottom in December 2018; it also informs the Fibonacci trend retracement lines shown on the right side of the chart. From that bottom, the stock has rallied more than 30%, which means that the stock is currently in a nice, intermediate-term upward trend. Over the last couple of weeks, the stock has been rallying off of support in the $79 range and appears ready to break above pivot resistance at about $85 per share. A push above that level would confirm the intermediate trend and should provide additional bullish momentum to test the stock’s next resistance level between $90 and $91 as shown by the 38.2% Fibonacci retracement line. A break above that point would likely help the stock push its trend even further in both price and time, with the next resistance at around $108 as shown by the 61.8% Fib retracement line.
Near-term Keys: If you’re looking for a short-term bullish trade, look for a break above $85 per share. That would be a very good signal to buy the stock or start working with call options with a short-term target around $90. A break below the stock’s closest support at $79, however could signal an end to the stock’s current intermediate upward trend, so that could be a good signal to consider shorting the stock or buying put options, with a target price for a bearish trade in the $73 range at the stock’s next most likely support level.