Since the beginning of 2018, the Materials sector has been one of the worst-performing sectors in the market. Despite an increase since the end of last year of a little more than 10%, the sector remains down more than 14% since January 2018. Concerns throughout the period about increasing commodity costs have been compounded more recently by indications of a slowing global economy that is also showing signs of rippling the United States, not to mention trade concerns that have yet to find a resolution as the U.S. and China keep talking.
The market seems anxious to price the expectation of trade peace into its current levels, which also means that even if a trade deal is reached, investors could simply apply the classic “buy the rumor, sell the news” mantra, putting a lid on any near-term upside the broad market may have. That could be true even as the Federal Reserve is expected to maintain the accommodative, “wait and see” approach that it has given the market the impetus for its increase to this point. That implies sectors like Materials, which are highly sensitive to economic cyclicality on both a domestic and global scale; but it could also signal opportunity for stocks in that sector for the careful, calculated investor.
One of the most interesting stocks in the Materials sector is Huntsman Corp. (HUN), a mid-cap Chemicals company that is down more than 34% since September 2018, and a little under 50% since hitting a high around $36 in January. This is a company that produces chemicals that are used to create products in practically every industry think of, from consumer good (think products like detergent and textiles for apparel and home furnishings) to resins for automotive, marine, and construction applications, and polymer products for coatings, adhesives, and electronics. Their fundamentals are generally solid, but are also showing some signs of weakness that seem to reflect some of the economic pressures that I already outlined. Does that mean HUN is a stock to say away from, or does it create a useful value-oriented opportunity for the smart long-term investor?
Fundamental and Value Profile
Huntsman Corporation is a manufacturer of differentiated organic chemical products and of inorganic chemical products. The Company operates all of its businesses through its subsidiary, Huntsman International LLC (Huntsman International). The Company operates through five segments: Polyurethanes, Performance Products, Advanced Materials, Textile Effects, and Pigments and Additives. Its Polyurethanes, Performance Products, Advanced Materials and Textile Effects segments produce differentiated organic chemical products and its Pigments and Additives segment produces inorganic chemical products. The Company’s products are used in a range of applications, including those in the adhesives, aerospace, automotive, construction products, personal care and hygiene, durable and non-durable consumer products, digital inks, electronics, medical, packaging, paints and coatings, power generation, refining, synthetic fiber, textile chemicals and dye industries. HUN’s current market cap is $5.2 billion.
Earnings and Sales Growth: Over the last twelve months, earnings declined nearly -32%, while revenues were mostly flat but positive by about 1.5%. In the last quarter, both numbers turned strongly negative, with earnings declining more than -38% and revenues dropping about -8.5%. The company’s narrow margin profile is also deteriorating, with Net Income as a percentage of Revenues at -1.52% in the last quarter versus only 3.59% in the last twelve months.
Free Cash Flow: HUN’s free cash flow is very healthy at $894 million. That translates to a Free Cash Flow Yield of 16.7%.
Debt to Equity: HUN has a debt/equity ratio of .81. This is a conservative number, but it increased from .57 in the quarter previous. The deterioration in the company’s Net Income is also reflected by a decrease in liquidity that could present problems in the quarters ahead.. Total cash in the last quarter was $340 million, while long-term debt is $2.2 billion.
Dividend: HUN pays an annual dividend of $.65 per share, which translates to an annual yield that of about 2.9%.
Price/Book Ratio: there are a lot of ways to measure how much a stock should be worth; but one of the simplest methods that I like uses the stock’s Book Value, which for HUN is $11.53, and which translates to a Price/Book ratio of 1.17 at the stock’s current price. HUN’s Book Value declined sharply in the last quarter from $16.63 per share. Their historical average Price/Book ratio is 2.46, which means the stock is current sitting almost 28% below a long-term target price at around $28 per share. That number is supported by a Price/Cash Flow ratio that is about 20% below its historical average.
Technical Profile
Here’s a look at the stock’s latest technical chart.
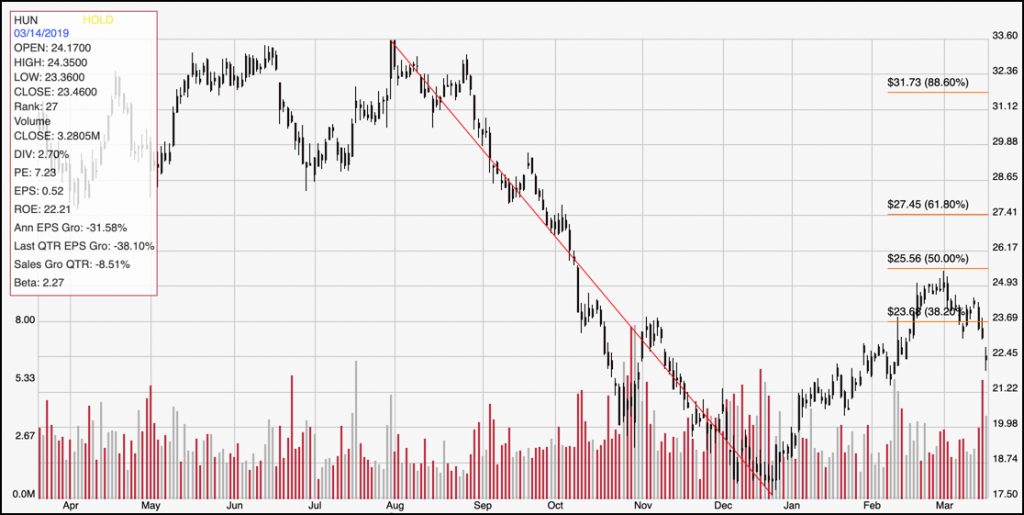
Current Price Action/Trends and Pivots: The diagonal red line on the chart above traces the stock’s downward trend from July to the end of the year. It also provides the baseline for the Fibonacci retracement lines shown on the right side of the chart. The stock has increased from that December low at around $17.50 per share, but has more recently dropped from a peak at $25 and right now is below the 38.2% retracement line at about $24. Near-term support is around $21, but if the stock breaks below that point the stock should retest that 52-week low point. The stock would need to break above its $25 peak to maintain any kind of bullish momentum.
Near-term Keys: The stock doesn’t really seem to be offering a clear opportunity for either a bullish or bearish trade at the present time, on either a short or long-term basis. If you want to work with the stock for a bullish momentum-based trade, you should look for a break above $25 as a signal. A drop below support at $21 could offer an opportunity to short the stock or buy put options. While the value proposition appears interesting, the stock’s shaky fundamentals make it look more like a value trap than a legitimate opportunity right now. I would wait to see the stock’s earnings, Net Income and liquidity shown significant signs of improvement before taking any long-term position seriously.