As a value-oriented investor that uses fundamental analysis to screen the market for attractive opportunities, I’ve had to learn over the years how to differentiate between a stock that looks like a good bargain versus those that really are. The irony of that statement is that just as no stock investment is ever guaranteed, the opinion that a stock really isn’t a good bargain also is sometimes proven very, very wrong. Fortunes can and often do change in a market economy very quickly, for any number of different reasons; however since being a successful investor over any time period is infinitely more difficult if you simply leave the matter in the hands of chance, smart investors look for a preponderance of evidence to guide a decision in one direction or another.
So what is that evidence? Some investors like to focus on companies they know, or that produce goods and services they make regular use of. That’s not a terrible approach, in my opinion, so long as you don’t pin your final decision of whether to initiate a trade or take a long-term position in a stock on that basis alone. Instead, over the years I’ve come to rely on a number of common fundamental measurements that each tell a story about a piece of a company’s business. Using them all together creates a broadly focused narrative that I think makes it easier to look beyond the simple, emotional tendency to look at a stock with a familiar name and say, “I know that company; I like what they do,” and then place a trade with nothing more justify your decision.
Value analysis adds to the fundamental profile of a company to give you an idea about whether or not the stock’s business operations are strong enough to make its price a good bargain right now. To paraphrase Warren Buffet, the objective should always be to “buy a good company at a nice price.” The mistake some folks who like to think of themselves as value investors make is to think that just because a stock may be trading at a discount based on valuation measurements, that is must be a good bargain, and therefore is a good investment right now. That’s a bit like mining for fool’s gold, in my opinion, because the market tends to be very efficient, and has proven itself to be quite good at pricing a company’s fundamental quality into its stock price. That means that if the fundamentals don’t provide a solid reason to believe the stock should be worth more than it is right now, the odds that it will are much, much lower.
Netgear, Inc. (NTGR) is an example of a stock that I think a lot of contrarian investors might be tempted to think about working with right now. The stock is more than 50% below a high around $78 in July of last year, a decline that has accelerated since the beginning of the year since the stock is almost 33% lower since January. Why might NTGR be attractive with such poor performance? Contrarian theory works off of the basis that all trends are finite, which means that the longer an upward trend lasts, the more likely it becomes to reverse turn lower. In the same way, a downward trend will eventually, and inevitably turn back to the upside.
The sheer size of the drop NTGR has experienced over the last several months certainly could give one pause and start to wonder if the worst is finally over. If you add to that mix the fact that stock has an interesting, if not quite compelling, value proposition right now, some solid fundamental strengths, and name brand recognition that make the company the leading home and small business networking provider with a market share in access of 50%, there is an argument to be made. So why do I think the company’s fundamentals actually should chase you away from this stock right now? Let’s take a look.
Fundamental and Value Profile
NETGEAR, Inc. designs, develops and markets networking solutions and smart connected products for consumers, businesses and service providers. The Company’s product line consists of devices, such as network attached storage, Internet protocol (IP) security cameras, and home automation devices and services. The Company’s segments include retail, commercial and service provider. The retail business unit is focused on individual consumers and consists of whole home wireless fidelity (WiFi) networking solutions and Smart connected products. The commercial business unit is focused on small and medium-sized businesses and consists of business networking, storage and security solutions. The service provider business unit is focused on the service provider market and consists of made-to-order and retail-proven whole home networking hardware and software solutions, including fourth-generation (4G) long term evolution (LTE) hotspots sold to service providers for sale to their subscribers. NTGR has a current market cap of about $1.1 billion.
Earnings and Sales Growth: Over the last twelve months, earnings have declined more than -18.5%, while revenues dropped by about -27%. In the last quarter, both numbers remained negative, but revenues declined much faster than earnings, at nearly -28% (revenues) versus about -6% (earnings). The company’s margin profile is also a sign of trouble; over the last twelve months Net Income was -.05% of Revenues. In the last quarter, both Net Income and Revenues were negative, which is a pretty alarming sign by any measure. This is an indication of a deteriorating balance sheet.
Free Cash Flow: NTGR’s free cash flow was -$115 million over the last twelve months, which is a validation of the deteriorating picture I just painted based on the company’s Net Income.
Debt/Equity: NTGR has no long-term debt, which means that all of the cash and liquid assets they have can be used to cover any short-term needs they have. In the last quarter, cash was a little over $274 million. That is something that many analysts would point to as an important sign of strength; however when you consider that the company is bleeding money from one quarter to the next right now, you begin to understand that the company’s “war chest” is only getting smaller with each passing quarter.
Dividend: As with most stocks in in the Technology sector, NTGR does not pay a dividend.
Price/Book Ratio: there are a lot of ways to measure how much a stock should be worth; but one of the simplest methods that I like uses the stock’s Book Value, which for NTGR is $19.87 and translates to a Price/Book ratio of 1.76 at the stock’s current price. Considering that the stock’s historical average Price/Book ratio is 2.175, you can put a long-term target price for the stock at around $43 per share. That sounds pretty nice; but the fact that in the previous quarter, the company’s Book Value was more than $29.50 per share should throw pretty cold water on the idea that the stock actually offers any kind of realistic value right now.
Technical Profile
Here’s a look at the stock’s latest technical chart.
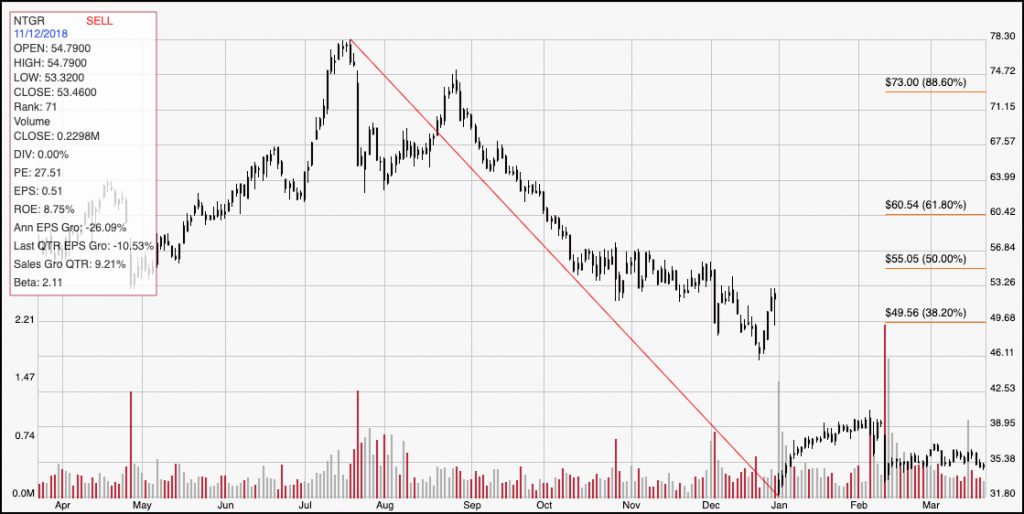
Current Price Action/Trends and Pivots: The red diagonal line measures the length of the stock’s downward trend from July to the end of December of last year; it also informs the Fibonacci trend retracement lines shown on the right side of the chart. The stock’s decline from a high at around $78 is unmistakable. Since hitting bottom at around $32 in January, the stock has trailed the rest of the market, mostly holding its value between about $35 and $38. That range defines both the opportunity and the risk in the stock right now. If it can push above $38, the stock could have room to fill at least half of the gap that was created when the stock cratered from about $53 to $32. The midpoint of that gap is at around $44. On the other hand, a drop below $35 should certainly translate to a test of the stock’s 52-week low price around $32; a further drop below that point could push the stock into the $25 to $28 range, which are levels the stock hasn’t seen in about two years.
Near-term Keys: Since there really is no basis for a good long-term investment based on fundamental and value analysis right now, the only kind of reasonable trades to look for on NTGR should be strictly short-term in nature. Look for a break above $38 could be a decent signal for a bullish momentum trade using call options or simply buying the stock itself. A drop below $32, which I believe is far more likely given the strength of the downward trend and the company’s deteriorating fundamental profile, would be a good signal to think about shorting the stock or buying put options with a target price between $25 and $28 per share.