Over the last week, the market has been muted by concerns about a weakening global economy. That concern is compounded at least by the effects of tariffs between the U.S. and its trading partners over the past year. Steel and aluminum tariffs, for example were among the first imposed, and the target of those tariffs wasn’t just China, despite the fact that U.S.-China negotiations have dominated the headlines for months now. They included Europe, Canada and Mexico, and were just the first salvo in a dispute that you have to acknowledge is contributing to indications of a global economy as well as to recessionary fears in the United States.
Companies in the Metals & Mining industry, like the rest of the Materials sector tend to be highly cyclical and sensitive to economic pressures. That’s why some of the biggest players in the sector, like Alcoa Corporation (AA) and Newmont Mining Corp (NEM) have declined over the course of the past year. Optimism about a trade deal has helped give these stocks a boost so far this year. One of the exceptions to the industry’s difficulty over the year is Kaiser Aluminum Corp (KALU), which has bucked the industry trend and is up slightly over the past year. Since the beginning of 2019, the stock is up about 16%, but has retraced back about 8% over the past months as the fears I just outlined put new pressure on the industry.
Early this week, hope of a trade deal has been re-ignited as high-level officials with both the U.S. and China will be meeting over the course of the next couple of weeks. The Trump administration’s top negotiator, Robert Lighthizer, and Treasury Secretary Steve Mnuchin will be in Beijing on Thursday while China’s top negotiator will visit the U.S. the following week. The hope is that if negotiations proceed well, it could pave the way for Trump and China’s President, Xi Jinping to finalize a deal sometime next month. It’s certainly possible a trade deal could provide a new opportunity to work with KALU; but since its all-time high is only 8% away, the real question is if the stock has a good fundamental and value-based reason to go higher. Let’s dive in and take a look.
Fundamental and Value Profile
Kaiser Aluminum Corporation manufactures and sells semi-fabricated specialty aluminum mill products. The Company operates in the Fabricated Products segment. The Company’s Fabricated Products segment focuses on producing rolled, extruded and drawn aluminum products used principally for aerospace and defense, automotive and general engineering products that include consumer durables, electronics, electrical and machinery and equipment applications. The Company offers its products for various end market applications, such as aerospace and high strength (Aero/HS products); automotive (Automotive Extrusions); general engineering (GE products), and other industrial (Other products). The Company’s fabricated aluminum mill products include flat-rolled (plate and sheet), extruded (rod, bar, hollows and shapes), drawn (rod, bar, pipe and tube) and cast aluminum products. KALU’s current market cap is $1.7 billion.
Earnings and Sales Growth: Over the last twelve months, earnings and sales both grew, with earnings increasing nearly 45%, and sales growing a little over 10%. Growing earnings faster than sales is hard to do, and generally isn’t sustainable in the long term; but it can also be a positive mark of management’s ability to maximize their business operations. This is a pattern that puts KALU ahead of its industry brethren, most of whom experienced flat to negative earnings and revenue over the last year. The company operates with an adequate margin profile; over the last twelve months, Net Income was 5.78% of Revenues over the past year, and improved in the last quarter to a little more than 6%.
Dividend Yield: KALU pays a yearly dividend of $2.40 per share, which translates to an annual dividend of around 2.3%.
Free Cash Flow: KALU’s free cash flow, like their operating margins is adequate, if not quite as high as I’d normally prefer to see, at $76.7 million. That translates to a Free Cash Flow Yield of 4.51%. It should be noted that Free Cash Flow increased more than 50% in the last quarter, from just a little over $50 million.
Debt to Equity: KALU has a debt/equity ratio of .50. This is a low number that generally suggests debt management shouldn’t be a problem. The company’s balance sheet shows about $162.3 million in cash and liquid assets against $370.4 million in long-term debt. It is worth noting that cash has dropped from the beginning of 2017, when it peaked at a little over $280 million. Even so, liquidity is good, and the company’s operating margins are adequate to cover short-term cash needs as well as to service long-term debt.
Price/Book Ratio: there are a lot of ways to measure how much a stock should be worth; but one of the simplest methods that I like uses the stock’s Book Value, which for KALU is $44.87 per share, and which translates to a Price/Book ratio of 2.3. Their average Price/Book Value ratio is 1.975, which means the stock is overvalued by about 14.5%, with a “fair value” sitting at around $88 per share. That also means that in terms of long-term value, the stock would need to drop more than 30% from its current price to represent a compelling value.
Technical Profile
Here’s a look at the stock’s latest technical chart.
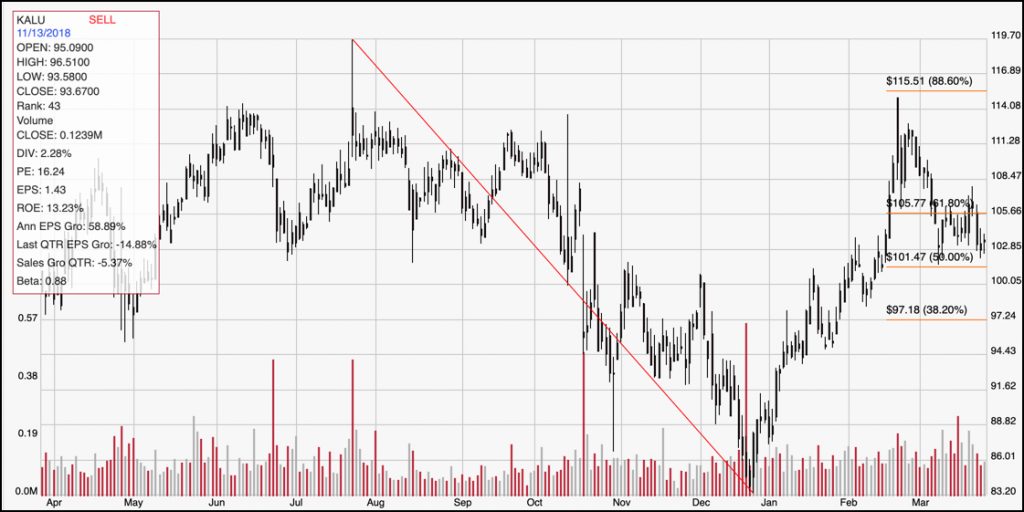
Current Price Action/Trends and Pivots: The chart above shows the last two year’s worth of price movement for KALU. The diagonal red line traces the stock’s decline from a high near $120 to its 52-week low at around $83 per share. It also informs the horizontal lines on the right side of the chart. The stock is well above those low, having traced a solid upward trend to a peak at about $115 per share in late February. From that point, the stock has pulled back to its current level and currently sits just above the 50% retracement line at around $101.50. In order to reassert the strength of that short-term upward trend, the stock would need to break above immediate resistance shown by the 61.8% retracement line to about $106 per share. It would also need to stay above that level for at least a trading session or two. If the stock drops below $101.50, the next immediate support is at the 38.2% retracement line in the $97 price area, with further support from that point somewhere between $91 and $93.
Near-term Keys: If a trade deal is reached within the next week, or even within the next couple of months, there is a good argument to be made for the stock to break higher and push near to its high at around $120. If the stock can break its current resistance and stay above $106, there is probably a good opportunity to buy the stock or use call options to work a short-term bullish trade with a target around the stock’s most recent pivot high at about $115. Use a drop below $101 as a signal to short the stock or to buy put option with a target price in that case at around $97 initially, or $94 if you think bearish momentum is increasing. Despite a mostly solid fundamental profile, KALU really doesn’t offer a compelling value proposition right now, which means that any trade you might consider for this stock should be limited in terms of duration as well as how much you expect to get out of it.