A couple of decades ago, I was a young man, just getting my start in the stock market and anxious to learn everything I could. One of the many books I was referred to, and was informed should be required reading for anybody just getting started, was One Up on Wall Street by Peter Lynch. Mr. Lynch made his name, and his fortune as the fund manager of Fidelity’s flagship Magellan mutual fund, driving the fund to market-beating performances throughout his tenure at the helm throughout the ’80’s.
I was intrigued by Mr. Lynch’s straightforward, commonsense approach to picking stocks to pay attention to. Like most new investors, I was overwhelmed by the prospect of trying to track so many different types of stocks in so many industries, and so when he talked about simple concepts like “invest in what you know,” I adopted that as a guideline that still influences me today.
Of course, the advantage of experience and education is that over time, you learn to adapt and modify the concepts and ideas given to you by others to suit your own needs and style. I came to understand that “invest in what you know” for me didn’t necessarily mean that just because I like Pepsi soda, Pepsico stock (PEP) was an automatic buy; it really became just the first, initial step in my analysis to narrow down the broad market to a more functional list I could start to use to find investments I did want to make.
I still find myself using that modified guideline quite a bit as I scan the market for new investing opportunities; when I have a fairly long list of stocks to consider, I almost always filter it according to names I recognize and can identify with. This week, one of the stocks that came up in one of those lists is a small-cap stock that I’ve been aware of for almost my entire professional career. Plantronics Inc. (PLT) is a company that is categorized in the Tech sector, and that you probably also have some familiarity with – at least if you’ve spent any time working in just about any kind of office setting and have ever had a reason to wear a headset to talk, on the phone or via web conference.
It’s a good thing that I’ve learned not to take simple familiarity as a signal to just go ahead and buy a stock because I recognize the name, or even if I really like the products associated with that business. PLT has some interesting things going for it, including outsized earnings and revenue growth numbers and a pretty big discount based on the stock’s Book Value; but when you dig a little deeper, you also find some issues that I think indicate the stock could be at risk to retest lows it saw at the end of last year.
Fundamental and Value Profile
Plantronics, Inc. (Plantronics) is engaged in the design, manufacture, and distribution of headsets for business and consumer applications, and other specialty products for the hearing impaired. The Company is a global designer, manufacturer and marketer of communications headsets, telephone headset systems, other communication endpoints and accessories for the business and consumer markets. The Company develops communication products for offices and contact centers, mobile devices, cordless phones, and computers and gaming consoles. Its product categories include Enterprise, which includes corded and cordless communication headsets, audio processors, and telephone systems, and Consumer, which includes Bluetooth and corded products for mobile device applications, personal computer (PC) and gaming headsets, and specialty products marketed for hearing impaired individuals. It offers its products under two brands: Plantronics and Clarity. PLT has a current market cap of about $6.9 billion.
Earnings and Sales Growth: Over the last twelve months, earnings increased by 45%, while revenue also increased, by nearly 122%. In the last quarter, earnings growth was more than 93%, while sales growth was more modest, and just a little under 4%. Despite those impressive growth numbers, the company’s margin profile is a big concern; in the last twelve months, Net Income was -7.3% of Revenues, and weakened even more to -8.3% in the last quarter. I see this as a sign that the company is overspending, increasing Revenues, possibly to prop up the stock at the expense of of long-term profitability.
Free Cash Flow: Over the last twelve months, PLT had $139.82 million in Free Cash Flow. That’s adequate, if not very remarkable, and translates to a Free Cash Flow Yield of a little over 7%. It’s also worth noting that Free Cash Flow increased from about $110 million in Q2 of 2018 to its current level. That doesn’t alleviate the concern raised by the company’s negative Net Income numbers, but it may be a sign the company’s profitability could be turning a corner.
Debt/Equity: PLT’s debt to equity ratio is 2.32, which is quite high. Their balance sheet shows about $342 million in cash and liquid assets against roughly $1.7 billion in long-term debt. Their deteriorating margin profile indicates that while they should be able to keep up with debt payments for the time being, liquidity is a concern and is likely to remain so for the foreseeable future.
Dividend: PLT’s dividend is $.60 per share and translates to a modest annual yield of 1.17% at the stock’s current price.
Price/Book Ratio: there are a lot of ways to measure how much a stock should be worth; but one of the simplest methods that I like uses the stock’s Book Value, which for PLT is $18.70 and translates to a Price/Book ratio of 2.72 at the stock’s current price. The stock’s historical average Price/Book ratio is 4, meaning that the stock is currently sitting about 47% below that average. That puts a long-term target price for the stock at nearly $75, which sounds really attractive; but I have a hard time justifying that price given the fundamental concerns I see in the company’s operating profile. Another counter is the fact the stock is a little more than 17% above its historical Price/Cash Flow average, which puts a “fair value” for the stock at only around $42 per share, and also suggests the stock would have to drop to about $35 per share before I would really be willing to say the stock is a great value.
Technical Profile
Here’s a look at the stock’s latest technical chart.
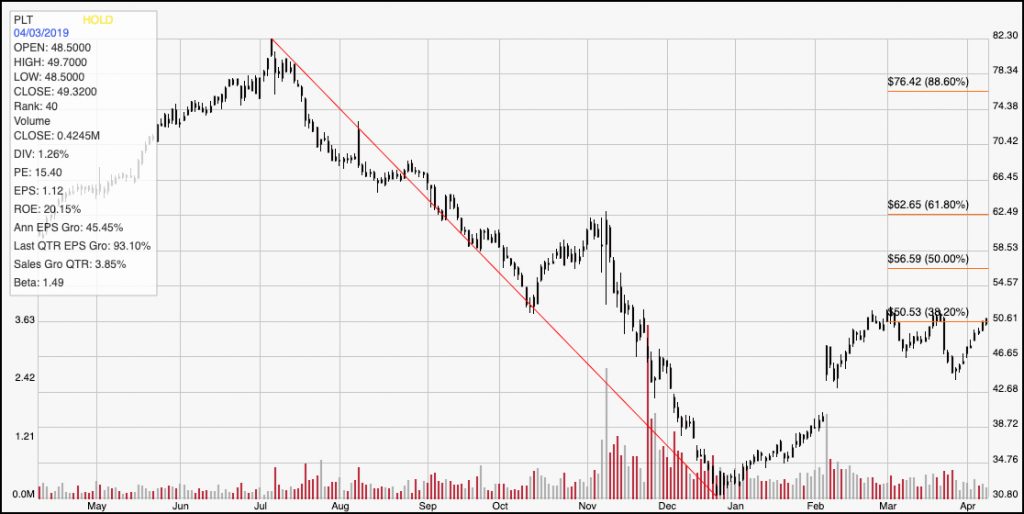
Current Price Action/Trends and Pivots: The red diagonal line measures the length of the stock’s downward trend from around $82 beginning in July of 2018, until the end of December when it bottomed around $31; it also informs the Fibonacci trend retracement lines shown on the right side of the chart. The stock has rallied nearly 65% from that low point. Since that low, and into the end of February, the stock rallied to about $50, with the stock consolidating through all of last month between $50 on the high end (also demonstrated by the 38.2 Fibonacci retracement line) and support at around $44 per share. The stock currently looks poised to push above that resistance; if it can hold above $51, the stock should see good short-term momentum to test the next resistance, around $56.50, or possibly $62 around the 61.8% retracement line. A break below support at $44 could see the stock retest its trend and multi-year low at $31 per share.
Near-term Keys: From a value-oriented standpoint, there really isn’t enough to justify any kind of a long-term bullish forecast for the stock right now; I would wait to see the company’s pattern of negative Net Income reverse and turn positive before I took any kind of long-term position seriously. If you’re willing to work with a short-term, momentum-based trade, a push above $51 could be an interesting signal for a bullish trade using call options or the stock itself. Be alert, however for a drop below support at $44; that would be a strong signal to short the stock or buy put options with a target anywhere between $31 and $35 per share.