This year has seen the broad market rally strongly to begin testing its all-time highs established in September of 2018. That rally has favored just about every sector of the market, including the Materials sector. As measured by the S&P 500 Materials Sector SPDR (XLB), the sector is up a little over 15% year-to-date. Normally, this kind of broad-based increase filters all the way down to the industry and individualized stock level. And it’s true that when you look through lists of single stocks, more often than not you see stocks whose increase has been comparable to that of the market’s; in many cases, it’s much, much bigger.
Among the types of stocks that you normally expect to see benefit from a broad-based rise in the market are those that are considered leaders of their respective industries – the so-called “big boys” of their own markets. One of the drivers for market optimism this year has been the expectation that the U.S. and China would eventually come to a compromise to put trade tensions to rest, including the continuation of the tit-for-tat tariffs that were a primary impetus for the market’s nearly -20% drop in the last quarter of 2018. That speculation is one of the reasons the Materials sector has performed so well this year, and that includes the Steel industry. So it’s a little surprising – and even intriguing – to see one of the most established and venerable U.S. steel producers down a little over 8% year-to-date, and as of the end of last week pushing below its pre-Christmas low around $17 per share.
Despite its status as one of the biggest steel producers in the country, United States Steel Corp (X) remains listed as a “small-cap” stock, at least in part because of the fact that the stock is down around 66% since March of 2018, when it peaked a little below $48 per share. That decline comes in the face of fundamental strengths that include healthy Net Income, a manageable level of debt, and extremely healthy earnings and sales growth. Does that make X a diamond in the rough, a stock that the market has ignored for all the wrong reasons? Perhaps; if you think that is the case, this stock could represent one of best values to be had under current market conditions. Take a look.
Fundamental and Value Profile
United States Steel Corporation is an integrated steel producer. The Company is engaged in producing flat-rolled and tubular products with production operations in North America and Europe. The Company operates through three segments: Flat-Rolled Products (Flat-Rolled), U. S. Steel Europe (USSE) and Tubular Products (Tubular). The Flat-Rolled segment includes the operating results of its integrated steel plants and equity investees in the United States involved in the production of slabs, rounds, strX mill plates, sheets and tin mill products, as well as all iron ore and coke production facilities in the United States. The USSE segment includes the operating results of U. S. Steel Kosice (USSK) and its integrated steel plant and coke production facilities in Slovakia. The Tubular segment includes the operating results of its tubular production facilities, primarily in the United States and equity investees in the United States and Brazil. X’s current market cap is $2.9 billion.
Earnings and Sales Growth: Over the last twelve months, earnings grew nearly 140% (not a typo) while revenue growth was less dynamic but still impressive at nearly 18%. Growing earnings faster than sales is difficult to do, and generally isn’t sustainable in the long-term; but it is also a positive mark of management’s ability to maximize business operations. X’s margin profile is a particular signal of fundamental strength; as a percentage of Revenues it increased from 7.8% over the last twelve months to 16% in the last quarter.
Free Cash Flow: X’s free cash flow measurement looks like a red flag, at -$53 million. It has also declined from about $450 million in mid-2017. I believe this is one of the biggest drivers of the stock’s decline this year; the market is taking this measurement at face value. Digging deeper, however shows that Free Cash Flow has declined because the company has been actively investing in operational improvements designed to refocus their business from their traditional steel products to “value-added” products that now represent about 70% of their business. Those initiatives are budgeted to continue into 2020, after which they should begin to accretive to their bottom line. I believe X’s improving Net Income is a strong indication of the traction those initiative have begun to show.
Debt to Equity: X has a debt/equity ratio of .55, which by itself is healthy. Their balance sheet shows $1 billion in cash and liquid assets against $2.3 billion in manageable long-term debt.
Dividend: X pays an annual dividend of $.20 per share, which translates to a yield of just a little over 1% at the stock’s current price. That isn’t very impressive by itself; but I do think the fact the company has maintained their dividend even as they have put increasing emphasis on transformation of their business is a signal of strength.
Price/Book Ratio: there are a lot of ways to measure how much a stock should be worth; but one of the simplest methods that I like uses the stock’s Book Value, which for X is $23.71 and translates to a Price/Book ratio of .7 at the stock’s current price. Their historical average Price/Book ratio is 1.73; that puts a target price above $41, which is 145% above the stock’s current price, and just a little below its March 2018 highs. Lest you think that is unrealistic the stock’s Price/Cash Flow ratio is also 147% below its historical average, providing nearly the same target price.
Technical Profile
Here’s a look at the stock’s latest technical chart.
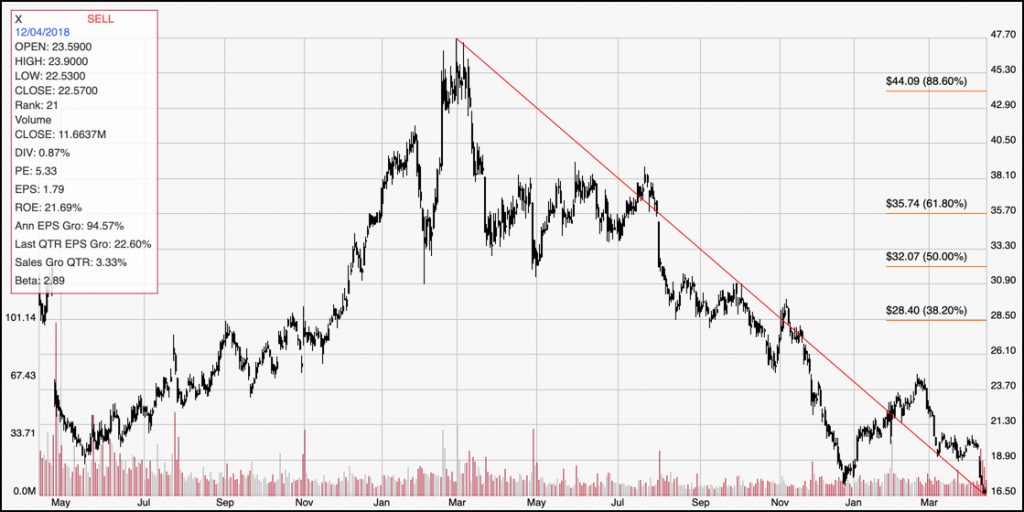
Current Price Action/Trends and Pivots: The diagonal red line traces the stock’s downward trend from March 2018 to the end of the year, and provides the reference for calculating the Fibonacci retracement levels indicated by the horizontal red lines on the right side of the chart. After rebounding to about $24 by the end of February before dropping back through March. It recently dropped below the stock’s multi-year low at around $17 and looks set to maintain that long-term downward trend. The stock could see support around $15.75, but if it drops below that mark, it could drop to as low as $13 before finding any new support. A push above $20 should give the stock good short-term bullish momentum, but the stock would need to push above the February pivot high at $24 to set any kind of sustainable upward trend.
Near-term Keys: I think the best opportunity with X is over the long-term; the value proposition is among the most compelling you are likely to find in the market right now, and I believe the fundamentals are a strong indication of the effectiveness of the company’s business strategy. If you are willing to be more aggressive in looking for a short-term oriented trade, the stock’s current momentum really doesn’t provide much justification for a bullish, momentum-based trade. I think the smart approach is to wait to see if the stock will break below support at $15.75; if it does, consider shorting the stock or buying put options with a short-term target at around $13. If the stock does regain some bullish momentum, a break above $20 should give the stock some room to rally to the $24 range, which could work for a bullish trade with call options, or simply buying the stock outright.