If you’ve been reading my daily posts for very long at all, you should be pretty used to seeing me evaluate companies throughout the market on the basis of both their fundamental strength as well as their value proposition. That’s because in the search for good investing opportunities, I’ve learned to rely on a few specific indicators altogether to help me identify stocks that are worth my attention.
First, since I prefer to look at long-term opportunities, it makes sense to me to look for stocks that are trading at or near extreme lows. Contrary to what most growth or momentum-focused investors prefer, where seeing stocks pushing through resistance levels to one high after another, I think the best opportunities over the long term come from stocks that are poised to end an extended downward cycle and begin a new cycle to the upside. What are the catalysts that provide the impetus for that reversal? There are a couple.
The first is a general consensus among investors that a stock’s price finally represents a great bargain that should no longer be ignored. Part of that analysis comes from seeing the stock start to rebound from an extreme low point and rally higher; another indication comes by measuring the stock’s current price against the historical valuation metrics. Those can start to give you clues that a stock could finally have dropped to a level that institutions are no longer willing to ignore.
The final piece of the puzzle comes from the stock’s underlying business. Are the company’s profits growing, and is the bottom line showing signs of renewed, or continued strength? If they are, the fact that the stock may be at historical lows means that there could be a big opportunity on the horizon. That is what makes these three pieces – current price, valuation measurement, and fundamental profile – so useful. Together, they do a pretty good job of helping me find good opportunities to work with.
Goodyear Tire & Rubber Co. (GT) is a stock that I’ve followed for a pretty long time, as much because of their status as an icon of American business and the important role they play in the Auto Components industry. With a downward trend that extends back to the beginning of 2018 from a high around $37 but has rebounded from a mid-March low around $17, the stock checks off two of those first pieces to my analysis puzzle. Rebounding off of an extreme low, signaling a potential reversal of that long-term downward cycle? Check. How about measuring the stock’s current price against historical valuation metrics? Check – the stock looks very compelling when you compare it to my favorite “fair value” metrics. How about the company’s fundamental strength? Maybe not. Let’s take a look and see where the numbers fall.
Fundamental and Value Profile
The Goodyear Tire & Rubber Company is a manufacturer of tires. The Company operates through three segments. The Americas segment develops, manufactures, distributes and sells tires and related products and services in North, Central and South America, and sells tires to various export markets. The Americas segment manufactures and sells tires for automobiles, trucks, buses, earthmoving, mining and industrial equipment, aircraft and for various other applications. The Europe, the Middle East and Africa (EMEA) segment develops, manufactures, distributes and sells tires for automobiles, trucks, buses, aircraft, motorcycles, and earthmoving, mining and industrial equipment throughout EMEA under the Goodyear, Dunlop, Debica, Sava and Fulda brands. The Asia Pacific segment develops, manufactures, distributes and sells tires for automobiles, trucks, aircraft, farm, and earthmoving, mining and industrial equipment throughout the Asia Pacific region, and sells tires to various export markets. GT’s current market cap is $4.6 billion.
Earnings and Sales Growth: Over the last twelve months, earnings declined more than -48%, while sales dropped about -5%. The picture isn’t better in the last quarter, with earnings dropping -25% and sales off about -1.3%. GT is a company that historically operates with a narrow margin profile, but even so is showing signs of alarming deterioration. In the last quarter, Net Income as a percentage of Revenues was only 2.83% versus 4.47% over the last twelve months.
Free Cash Flow: GT’s free cash flow measurement is unimpressive, at only about $107 million over the last year. That translates to a negligible Free Cash Flow Yield of just 2.33%. Even more concerning is the fact that Free Cash Flow dropped from almost $500 million in the previous quarter to its current level.
Debt to Equity: GT has a debt/equity ratio of 1.01. That is a bit high, but this is actually a pretty typical pattern for most companies in the Auto Components industry, and isn’t alarming by itself. That said, GT’s liquidity, which was very healthy just a few years ago (more than $2 billion at the beginning of 2015) has been consistently declining since that point. As of the last quarter, the company had $801 million in cash and liquid assets against about $5.1 billion in long-term debt. Their balance sheet indicates that while they should be able to maintain their debt service for the time being, they could be reaching a point where that story begins to change.
Dividend: GT pays an annual dividend of $.64 per share, which translates to a yield of just a little over 3.2% at the stock’s current price.
Price/Book Ratio: there are a lot of ways to measure how much a stock should be worth; but one of the simplest methods that I like uses the stock’s Book Value, which for GT is $21.76 and translates to a Price/Book ratio of 1.09 at the stock’s current price. Their historical average Price/Book ratio is 1.6; that puts a target price at nearly $35, which is 74% above the stock’s current price.
Technical Profile
Here’s a look at the stock’s latest technical chart.
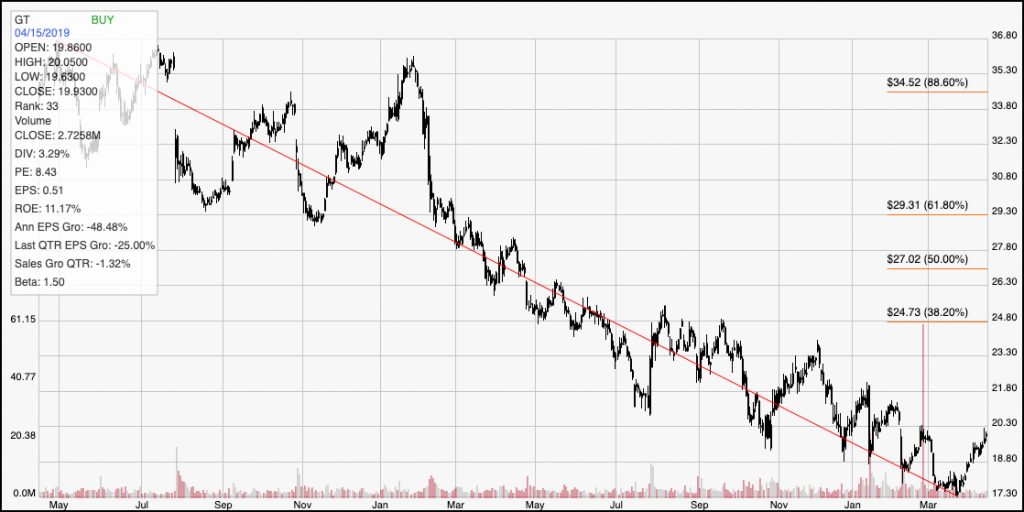
Current Price Action/Trends and Pivots: The diagonal red line traces the stock’s downward trend from May 2017 to mid-March, and provides the reference for calculating the Fibonacci retracement levels indicated by the horizontal red lines on the right side of the chart. The stock is currently rebounding off of a multi-year low at around $17 and is showing some interesting bullish momentum; however it is also sitting very near to resistance marked by the last pivot high at the beginning of March. The Fibonacci lines aren’t very useful right now considering the strength of the long-term downward trend; the stock would really need to break above $21, which means staying above that level for at least a couple of trading sessions, preferably with continued positive momentum before even the 38.2% Fibonacci retracement line at around $25 becomes remotely realistic for any kind of bullish forecast. The stock should have some support a little below $19, but if it drops below that level I would expect to see it re-test its March low around $17.
Near-term Keys: GT, unfortunately is a classic example in my opinion of a value trap; the valuation metrics look very tempting, but the company’s fundamentals really make it hard to believe there is any reason the market should really start pushing the stock higher, or to forecast any real significant long-term opportunity. I would need to see Net Income begin to turn back higher, as well as improving liquidity shown by available cash and liquid assets before I would take that very seriously. If you want to be aggressive, you could wait for a break above $21 and then consider buying the stock or using call options to ride a short-term rally to somewhere between $23 and $25; but don’t be surprised if a strong signal comes from a bearish drop below $19. That might not be a bad signal to short the stock or think about working with put options.