One of the challenges of watching the stock market on a daily basis is filtering out the noise of day-to-day market fluctuations. On Wednesday, for example, the market was up slightly for most of the day, but sold off late as investors shrugged off mostly favorable earnings reports and focused instead on selling off healthcare stocks. Most analysts point to political uncertainties surrounding the sector, as the Trump administration tries to renew efforts to reform healthcare.
Some might ask if efforts to turn the clock back on Obamacare is really bad news for the healthcare sector or insurance companies in general. In the long term, perhaps not; but if there is one thing that I think the last year of market activity has clearly emphasized for anybody willing to pay attention is that “no news is good news.” Investors abhor change, because change means uncertainty, and the market is already hard enough to predict even when people think most of the variables are understood.
That uncertainty has made healthcare one of the only sectors in the market that hasn’t followed the broad market strongly higher through this year; since the beginning of January the sector is down slightly (not quite -1%, as measured by XLV, the S&P 500 Healthcare Sector ETF), while the S&P 500 is up nearly 16% as of the close of the trading session yesterday. I think that makes insurance companies a risky way to invest under current market circumstances; but Quest Diagnostics Inc. (DGX) could be an interesting exception to the rule. This is a clinical lab provider that contracts with insurance companies throughout the country. Do their fundamentals and value proposition make them a stock to watch? Let’s take a look.
Fundamental and Value Profile
Quest Diagnostics Incorporated is a provider of diagnostic information services. The Company operates through two businesses: Diagnostic Information Services and Diagnostic Solutions. The Diagnostic Information Services business develops and delivers diagnostic testing information and services, providing insights that empower and enable a range of customers, including patients, clinicians, hospitals, integrated delivery networks (IDNs), health plans, employers and accountable care organizations (ACOs). Its Diagnostic Solutions group includes its risk assessment services business, which offers solutions for insurers, and its healthcare information technology businesses, which offers solutions for healthcare providers. The Company’s services are provided under the Quest Diagnostics brand, but it also provides services under other brands, including AmeriPath, Dermpath Diagnostics, Focus Diagnostics, Athena Diagnostics, ExamOne, Quanum and Care360. DGX has a current market cap of about $11.5 billion.
Earnings and Sales Growth: Over the last twelve months, earnings declined about – 1.5%, while revenues dropped by a little more than -5%. In the last quarter, earnings dropped by -19% while sales declined by about -2.6%. The company’s margin profile is shows signs of deterioration; Net Income as a percentage of Revenue was 6.9% in the last quarter versus 9.77% over the last twelve months.
Free Cash Flow: DGX’s free cash flow is adequate, at $817 million. That translates to a Free Cash Flow Yield of 6.81%.
Debt to Equity: DGX’s debt to equity is .63, which is generally pretty conservative, but that in this case, by itself paints a deceptive picture. The company’s balance sheet in the last quarter shows liquidity is a problem, with only about $135 million in cash and liquid assets versus $3.4 billion in long-term debt.
Dividend: DGX’s annual divided is $2.12 per share, which translates to a yield of 2.47% at the stock’s current price.
Price/Book Ratio: DGX’s Book Value is $38.71, which means that the stock’s Price/Book ratio is 2.21 versus their historical Price/Book ratio of 2.53, which suggests that the stock is undervalued by about 14.2% right now. The stock’s Price/Cash Flow is less encouraging, since it is trading only about 6% above its historical average. These numbers don’t make the stock a compelling value right now; the stock would realistically need to drop to somewhere between $73 to $78 before I would consider that to be the case.
Technical Profile
Here’s a look at the stock’s latest technical chart.
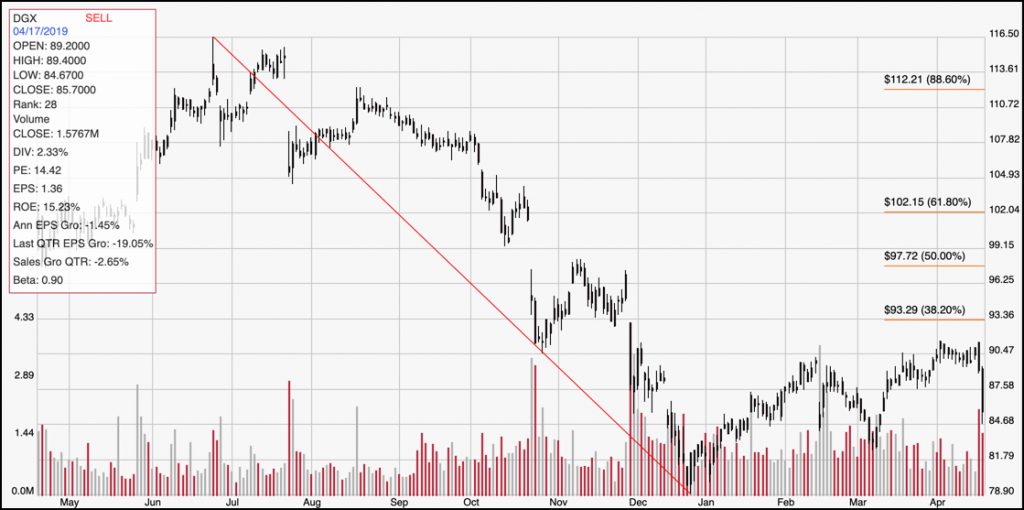
Current Price Action/Trends and Pivots: The diagonal red line traces the stock’s downward trend from late June 2018 to the end of the year, and provides the reference for calculating the Fibonacci retracement levels indicated by the horizontal red lines on the right side of the chart. DGX’s movement since the beginning of the year was consistent with the broad market, increasing from around $79 at its Christmas Eve low to about $91 – about 15% – at the beginning of April. In the last week, the stock has dropped sharply from that point to its current level around $86. Immediate support is at around $84, with the stock’s 52-week low at $79 within sight if the stock breaks below that support level. A rally above resistance at around $91 should give the stock momentum to push past the 38.2% Fibonacci retracement line to somewhere between $98 and $99 around the 50% line.
Near-term Keys: DGX fundamental profile is generally solid, but it is showing some signs of weakness in its earnings pattern, its deteriorating Net Income and liquidity that really don’t support any kind of significant value-based forecast. Given the stock’s current momentum, I think the stock is more likely to test its 52-week low than it is to rally higher. The means the best probabilities for this stock exist on the bearish side; take a break below $84 as a signal to consider shorting the stock or buying put options. If the stock does manage to push above $91 would be a signal to think about buying the stock or working with call options, with a target price at around $98.