It’s interesting to see how market dynamics affect different industries and sectors of the economy at different points in time. Historical trends and norms prompt us to categorize certain areas of the market as “defensive” or “cyclical,” “aggressive” or “conservative” simply because of the way the price activity those areas, or even individual stocks have previously correlated or diverged from the broad market. The problem with getting too locked in to those norms is that sometimes, they just don’t apply.
The Consumer Staples sector is an interesting example of what I mean. When the market moved into the first stages of correction at the end of September 2018, this was one of the only sectors that initially managed to hold its ground; in fact, from mid-October to the first week of November, the sector managed to rally more than 10% as measured by the S&P 500 Consumer Staples Sector SPDR ETF (XLP). From that point, however, the sector finally capitulated to the overwhelmingly bearish tone the broader market had taken by that time; from that high point to the last week of December, the sector dropped back more than 15%.
That end-of-the-year capitulation is interesting, because Consumer Staples is a sector that most investors, myself included, generally consider to be a sector that should offer good, relatively stable, even defensive investing opportunities during periods when the broader market seems to be turning increasing bearish. That idea held true through October, but was soundly refuted through the rest of 2018; and so far this year, the sector has been moving almost in lock-step with the broader market, rallying about 12% year-to-date and about 17% from that December low.
The almost entirely bullish sentiment and momentum that has rejuvenated the Consumer Staples sector has rippled into a number of Food stocks. Conagra Brands, Inc. (CAG) is one of the strongest examples since February. The stock dropped almost 50% from summer 2018 lows near $40 per share to a low at close to $20 before the end of the year, and then hovered between $21 and $22 through most of the beginning of the year before picking up serious momentum in February that accelerated in late March, pushing the stock above $22 and to a rapid ascent that now has the stock above $30 per share. That’s a rally that puts the stock up about 43% for the year – and the lion’s share of that move has come in just the last couple of months. From a technical perspective, such a rapid increase should naturally beg the question of whether the rally can continue; one of the ways to answer that question is to take a look at the stock’s fundamentals, and its value proposition. Let’s check it out.
Fundamental and Value Profile
Conagra Brands, Inc., formerly ConAgra Foods, Inc., operates as a packaged food company. The Company operates through two segments: Consumer Foods and Commercial Foods. The Company sells branded and customized food products, as well as commercially branded foods. It also supplies vegetable, spice and grain products to a range of restaurants, foodservice operators and commercial customers. Conagra Foodservice offers products to restaurants, retailers, commercial customers and other foodservice suppliers. The Company also operates in the countries outside the United States, such as Canada and Mexico. The Company’s brands include Marie Callender’s, Healthy Choice, Slim Jim, Hebrew National, Orville Redenbacher’s, Peter Pan, Reddi-wip, PAM, Snack Pack, Banquet, Chef Boyardee, Egg Beaters, Rosarita, Fleischmann’s and Hunt’s. The Company sells its products in grocery, convenience, mass merchandise and club stores. CAG’s current market cap is $14.8 billion.
Earnings and Sales Growth: Over the last twelve months, earnings decreased a little over -16%, while Revenues grew nearly 36%. In the last quarter, the decline in earnings accelerated, to almost -24%; Revenues improved by about 13.5%. The company’s margin profile over the last twelve months is improving, with Net Income at not quite 7% of Revenues over the past twelve months, but improving in the last quarter to almost 9%.
Free Cash Flow: CAG’s free cash flow is modest, but adequate at $575.6 million. That translates to a Free Cash Flow Yield of about 3.92%.
Debt to Equity: CAG has a debt/equity ratio of 1.49. That number declined from 1.58 in the previous quarter, but the number remains high, a reflection of the reality that the company’s liquidity could be a problem. In the last quarter Cash and liquid assets were $282.2 million versus $11.1 billion in long-term debt. Most of that debt is attributable to CAG’s acquisition of Pinnacle Foods in the last quarter of 2018; while industry experts cheered the move, CAG’s CEO has acknowledged that the combined company has introduced operational and strategy executional difficulties that they didn’t anticipate. That is one of the reasons the stock underperformed the rest of the market until late April.
Dividend: CAG pays an annual dividend of $.85 per share, which translates to an annual yield that of about 2.8% at the stock’s current price.
Price/Book Ratio: there are a lot of ways to measure how much a stock should be worth; but one of the simplest methods that I like uses the stock’s Book Value, which for CAG is $15.34. This marks a remarkable increase from just $9.74 in the third quarter of 2018. At the stock’s current price, their Book Value translates to Price/Book ratio of 1.98 versus an average historical Price/Book ratio of 3.9, which means that even with the stock’s recent rally, it remains more than 50% below a long-term target price at around $60 per share. Their Price/Cash Flow ratio is more conservative, but still attractive since it offers a discount about 18% below its historical average; that puts the stock’s target price quite a bit closer to its current level, but is still attractive at about $36.
Technical Profile
Here’s a look at the stock’s latest technical chart.
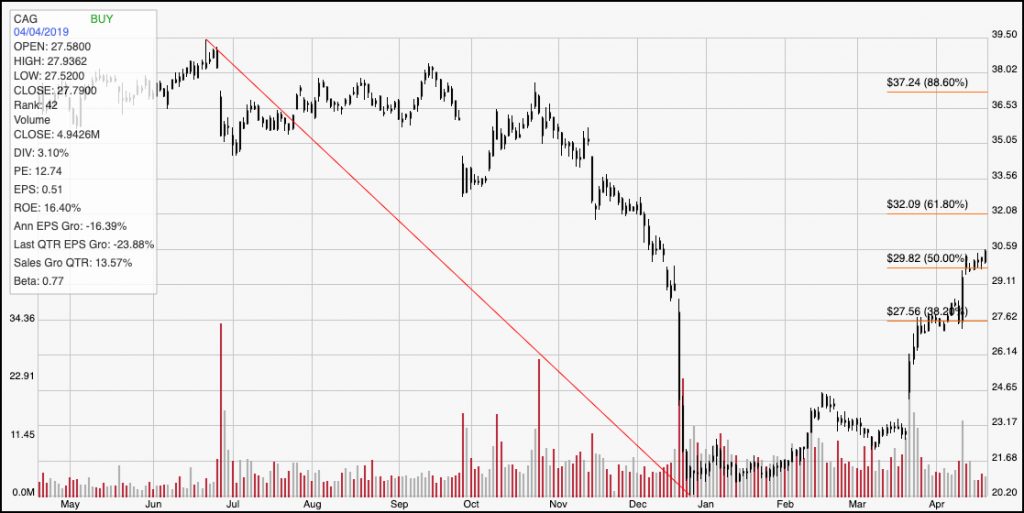
Current Price Action/Trends and Pivots: The stock’s break above its mostly sideways trend late last month has been impressive, pushing the stock above the 50% Fibonacci retracement line at about $30 per share, with good bullish momentum currently putting the next resistance level shown at the 61.8% retracement line within sight. A further break above $32 where that line sits should give the stock even more momentum over the intermediate term to push into the $37 to $38 range, and near to the stock’s 52-week high around $39.50. On the other hand, the 50% retracement line should now act as support; if the stock drops below $30, a test of the 38.2% retracement level at a$27.50 should be expected.
Near-term Keys: From a fundamental standpoint, CAG has a mostly positive profile; most of the cracks in that profile come from the aftereffects of the Pinnacle Foods acquisition, but by most reports, including those of CAG’s management, are solvable and the company appears to be making headway. If you think that is the case, the value proposition could still be very attractive right now – enough to start working with the stock on a long-term basis. If you prefer to work with shorter-term trades, there is a basis right now for a bullish play, either by buying the stock outright or by working with call options with a near-term target price at around $32. If the stock breaks its immediate support at $30, consider shorting the stock or buying put options, with an exit price at the 38.2% retracement line at around $27.50.