One of the most cyclical sectors of the market, not surprisingly, is the Consumer Discretionary sector. This is because such a big portion of the sector is made up of highly individualized businesses that cater to a wide variety of consumer tastes. Apparel, footwear, electronics, restaurants, and so on – the disparity between many of these businesses is so distinct that the stock market doesn’t really try to distinguish between them too much; instead, they all simply get lumped in to the “Specialty Retail” industry.
Why does that disparity contribute to cyclicality? Because consumer trends can and often do shift for almost as many different reasons as there are consumers. One of those factors is the economy itself; one of the primary measurements of broad economic health, for example is income growth. When wages are improving, workers have more disposable income to work with, which usually translates to higher profits for many of the trendy businesses that make up the Specialty Retail industry. When the economy starts to struggle, businesses begin to scale back spending, which often means cutting payroll. Unemployment goes up, income levels begin to go down, and the affordability of many of those once-trendy and popular brands becomes harder to justify.
Designer Brands Inc. (DBI) is a company in the Specialty Retail industry that seems to be positioning itself with a happy balance between the trendy, popular aspect that often drives sales in healthy economic periods and affordability that consumers often start to focus on in more difficult economic conditions. You might not be familiar with their name, but that is because the company just finished a corporate reorganization, changing their name from the more recognizable DSW Inc. The reorganization, and the name change is intended to reflect the company’s evolution over the last few years, largely via acquisition, to expand its capabilities beyond the 500 stores for which it’s best known. I think those changes, including a focus on growing its higher margin private label business – which currently makes up about 10% of sales – to 25 to 30 percent of sales. Does that mean the company could be a good bargain at its current price? Let’s take a look.
Fundamental and Value Profile
Designer Brands, Inc., formerly DSW Inc., is a footwear retailer. The Company offers an assortment of brand name dress, casual and athletic footwear and accessories for women, men and kids. The Company operates through two segments: the DSW segment (DSW), which includes DSW stores and dsw.com, and the Affiliated Business Group (ABG) segment. As of January 28, 2017, the Company operated 501 DSW stores, dsw.com and shoe departments in 288 Stein Mart stores and Steinmart.com, 106 Gordmans stores and Gordmans.com, and one Frugal Fannie’s store. DSW separates its merchandise into three primary categories: women’s footwear; men’s footwear, and accessories and other (which includes kids’ footwear). Other primarily includes Ebuys and its investment in Town Shoes. The ABG segment partners with three other retailers to help build and optimize their in-store and online footwear businesses. DBI’s current market cap is $1.4 billion.
Earnings and Sales Growth: While sales have increased over both the last twelve month (17.14%) and the last quarter (1.24%), earnings have declined sharply, at -118.42% over the last year and -110% in the last quarter. The decline in profitability is also reflected in the company’s margin profile, which shows Net Income was -.6% over the last twelve months and -5.4% in the last quarter. That is a concern; but it is also attributable primarily to a one-time write down for the Ebuys business and costs associated with the acquisition in the fall of 2018 of the Camuto Group, which was a central piece that gives the company the ability to focus more heavily on its private label business.
Free Cash Flow: Despite the negatives just demonstrated, DBI’s free cash flow looks mostly healthy; over the last twelve month it had almost $110 in free cash flow, which translates to a Free Cash Flow Yield of a bit over 6%.
Debt to Equity: DBI has a conservative debt/equity ratio of .19. The company’s ability to service its debt isn’t really a concern, although there is no doubt that a reversal of the negative pattern in its Net Income should be high on any investor’s priority list. DBI’s balance sheet shows $169 million in cash and liquid assets against $160 million in long-term debt.
Dividend: DBI pays an annual dividend of $1.00 per share, which translates to a yield of 4.44% at the stock’s current price.
Price/Book Ratio: there are a lot of ways to measure how much a stock should be worth; but one of the simplest methods that I like uses the stock’s Book Value, which for DBI is $10.36 per share and translates to a Price/Book ratio of 2.03 at the stock’s current price. Their historical Price/Book average is 2.24, which suggests that the stock is trading at a discount right now of just under 10%; however, the stock’s Price/Cash Flow ratio offers an interesting counter-perspective, since it is currently running about 21.5% below its historical averages. The historical Price/Book ratio puts the stock’s “fair value” target price at around $23.20, while the Price/Cash Flow valuation sets a much more attractive target above $25.50 per share.
Technical Profile
Here’s a look at the stock’s latest technical chart.
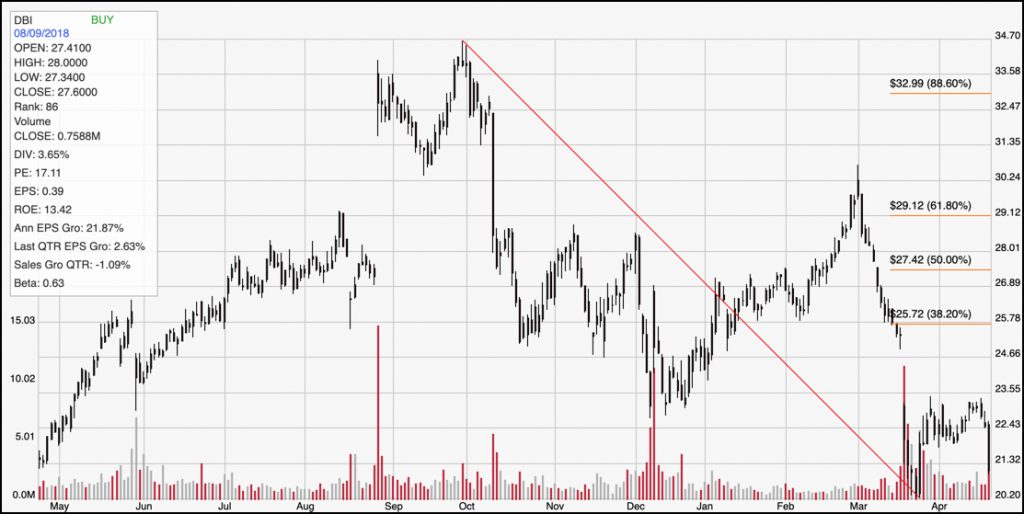
Current Price Action/Trends and Pivots: The red diagonal line traces the stock’s downward trend from September 2018 to late March of this year; it also informs the Fibonacci retracement lines shown on the right side of the chart. While the stock followed the rest of the market higher at the beginning of the year, hitting a highwater mark at around $30, it tumbled back quickly beginning in March, hitting a new 52-week low in the latter part of the month. More recently, the stock has dropped back from about $22 and appears set to retest that low point. If the stock can break above its closest resistance at about $23, it should have room to run at least to the 38.2% retracement line at about $26. A push below the current 52-week low at around $20 could see the stock test lows in the $16 to $18 range that were last seen in the latter part of 2017.
Near-term Keys: If you like the company’s expansion plan – and I think there is a lot to like about expanding their private-label capability, especially since that would be a portion of the business that should be less susceptible to broad economic weakness – The stock could offer an interest value at its current price. Considering the price weakness we’ve seen in the last six weeks, however it looks like the stock could offer a much better value opportunity if it does continue to break down. A drop down to pivot support in the $18 range would offer a value proposition based on the company’s historical Price/Book ratio of more than 27%, and almost 40% based on its Price/Cash Flow ratios. If you prefer to work with a short-term trade, look for a push below $20 as a signal to short the stock or start working with put options, with a target between $18 and $16 to exit that trade. In the short-term a bullish trade looks like a very low probability proposition and shouldn’t be considered unless the stock does manage to break above $23 per share.