Anybody that follows the market with any kind of regularity knows who Jim Cramer is. After establishing a solid reputation as a money manager running his own hedge fund in the 1990’s, where he gained fame by posting only a single year of negative returns, Cramer retired from money management in 2001 and began running cable television program Mad Money on CBNC in 2005. He’s been on TV every day, Monday through Friday, ever since, both on Mad Money as well as on CNBC’s daily, early morning market coverage. Bombastic? You bet he is; but the truth is that a lot of people pay attention to him and follow the stocks he talks about, both on television and through the website TheStreet.com, which is the subscription-based market information services that publishes his stock picks.
Most of the time, I don’t pay too much attention to Cramer’s picks, not because I think he gives bad information, but because my investment style and preferences are significantly different than his. He uses many of the same fundamental measurements I make use of, but where I focus on value-based principles, Cramer’s focus is on growth. That generally means that the stocks you might invest in are more aggressive and risky, because in most cases they’ve already experienced a big gain in stock price. Since I prefer to focus on stocks that are discounted relative both to historical price cycles as well as to generalized valuation measurements, these are usually the last kinds of setups I look for.
Perhaps it is that difference that made me notice recently when Cramer started talking about Texas Instruments Inc. (TXN). Like most of the Semiconductor industry, the stock struggled through most of 2018, bottoming just before Christmas at around $89 per share. That pushed the stock about 25% below its high above $119 in the middle of the year, but just as the market and the industry have recovered from that point, so has TXN. As of yesterday’s close, the stock managed to push above that high price and appears to have strong bullish momentum behind it. That sounds like a perfect set up for a growth-oriented investing strategy, which made it no real surprise to hear Cramer start talking about the stock.
The part that made me take notice was that Cramer was talking about TXN almost from a value-based perspective. Pointing out that the entire semiconductor industry struggled through 2018, partly as a result of the ongoing trade standoff between the U.S. and China and also by persistent indications that semiconductor supply remains significantly above demand, Cramer observed that if you take a wait-and-see approach for those trends to reverse, you’ll miss the boat. Given the strength of the stock’s rally this year, I’m forced to wonder if he’s already too late, or if there is actually a reasonable basis to suggest the stock should keep going up. Let’s run the numbers and see what we can find out.
Fundamental and Value Profile
Texas Instruments Incorporated designs, makes and sells semiconductors to electronics designers and manufacturers across the world. The Company operates through two segments: Analog and Embedded Processing. As of December 31, 2016, the Company had design, manufacturing or sales operations in more than 30 countries. The Company’s Analog segment’s product line includes High Volume Analog & Logic (HVAL), Power Management (Power), High Performance Analog (HPA) and Silicon Valley Analog (SVA). HVAL products support appliTXNions, such as automotive safety devices, touchscreen controllers, low-voltage motor drivers and integrated motor controllers. The Company’s Embedded Processing segment’s product line includes Processor, Microcontrollers and Connectivity. Processor products include digital signal processors (DSPs) and appliTXNions processors. DSPs perform mathematical computations to process digital data. TXN’s current market cap is $111.2 billion.
Earnings and Sales Growth: Over the last twelve months, TXN’s earnings grew 16.5%, while revenues decreased not quite -1%. In the last quarter, earnings and revenues were both sharply negative; earnings declined by nearly -20% and revenues by almost -13%. The company operates with a very impressive margin profile, since Net Income over the last twelve months as well as the most recent quarter were around 34%.
Free Cash Flow: TXN’s free cash flow is very healthy, at more than $6 billion for the last twelve months. This number has also increased steadily since the last quarter of 2013. One interesting point is that in October, TXN’s CEO was among many industry leaders that began warning about headwinds from oversupply issues as well as trade pressures; despite those realities, Free Cash Flow continued to grow nearly 10% from that point to now.
Debt to Equity: TXN has a debt/equity ratio of .48. This number is generally low, and reflects a conservative management philosophy about its use of leverage. The company also has excellent liquidity, with more than $4 billion in cash and liquid assets against about $5 billion in long-term debt.
Dividend: TXN pays an annual dividend of $3.08 per share, which translates to a yield of 2.65% at the stock’s current price.
Price/Book Ratio: there are a lot of ways to measure how much a stock should be worth; but one of the simplest methods that I like uses the stock’s Book Value, which for TXN is $9.36 per share and translates to a Price/Book ratio of 12.65 at the stock’s current price. This is where the cracks start to show up in the argument for thinking about the stock as a bargain right now; the stock’s historical Price/Book ratio is only 7.16, suggesting that stock is about -43% overvalued right now. That means that the baseline “fair value” for the stock is really around $67 per share. That’s not the bargain price, mind you – that’s just the price that most value-oriented investors would concede represents a fair value for the stock under normal market conditions. The stock hasn’t been that low since late 2016.
Technical Profile
Here’s a look at the stock’s latest technical chart.
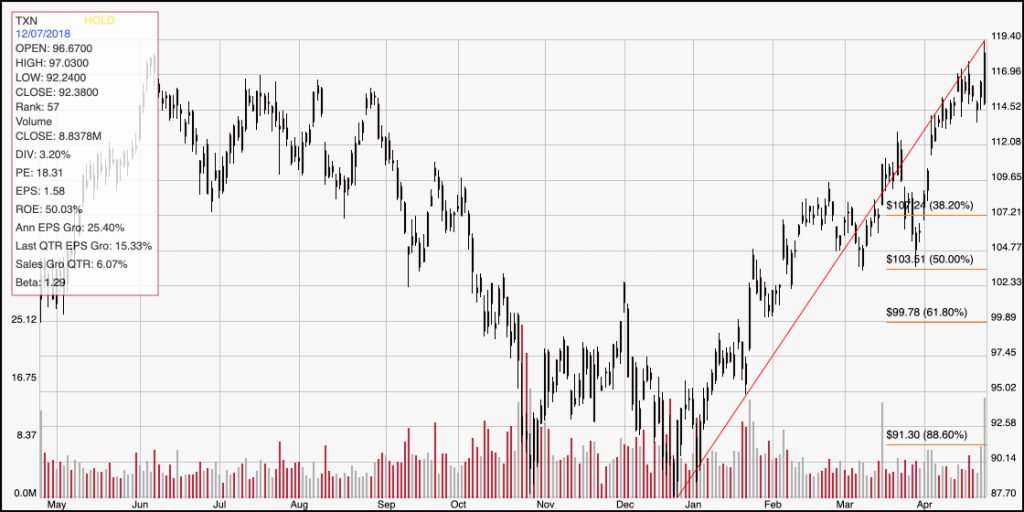
Current Price Action/Trends and Pivots: The chart above outlines the stock’s movement over the past year. The red line traces the stock’s intermediate upward trend from late December to right now; it also informs the horizontal Fibonacci retracement lines shown on the right side of the chart. The stock’s rally to a new 52-week high is impressive, and if this high is a true confirmation of the stock’s bullish momentum, this level should now begin to act as support; any kind of consolidation or stabilization around $117 or above should be considered a good indicator of that support. Assuming it does continue to push higher, the next most likely level of resistance is hard to identify, since this also represents a new all-time high; however we can work with the distance between the last break above resistance to the current level as a reference. That came at the beginning of this month as the stock pushed above a previous pivot high at around $112 per share, providing a short-term target around $124 to $125 per share. If the stock breaks down, it should find its next closest support around that $112 to $113 level.
Near-term Keys: The strength of TXN’s upward trend means that in the short to intermediate term, the best probabilities are, in fact, on the bullish side. Trying to work the bearish side of this stock isn’t a good probability trade, no matter whether you’re thinking about shorting the stock or working with put options. Look for a continued push above the latest high close as a confirmation of the stock’s short-term upward strength, and as a signal to buy the stock or work with call options with a near-term target price in the $124 to $125 range. Is the stock a good value at this price? I don’t think so; I believe that TXN is a pure growth play. I wouldn’t, however, call the stock a value trap, either, because the fundamentals are holding up well despite some of the negative pressures the industry has been dealing with.