A month ago, investors were put on edge by a rarely occurring phenomenon that most analysts, myself included, tend to view as a strong indication of a recessionary downturn. The spread between 3-month Treasury bills and 10-year Treasury bonds inverted, as the 3-month yield moved above the 10-year yield. It doesn’t happen very often, and when it does, it usually makes business more difficult for financial institutions, since banks rely heavily on a positive spread to to make money.
The inversion only lasted for about a week, and since then the spread has even begun to widen to more normalized levels. That shift back to positive territory has started to bring financial stocks back into favor for investors. Mostly positive economic indicators in the last week, including good signs from China, both for its national economic growth and on the trade front, and continued indications the Fed will maintain a “patient” philosophy on interest rates, imply that the much-feared economic downturn signaled by that inversion may not loom as large as a month ago.
If you want to watch the financial sector right now, it’s smart to keep a cautious eye, and to look for stocks that represent an excellent value. Citigroup Inc. (C) is a good example; since hitting a 52-week high at nearly $81 in January of 2018, the stock began an extended slide downward, falling all the way to the $65 level by the beginning of July. It staged a short-term bullish trend from that point, rallying to around $75 in late September before following the broad market’s correction to a new low in December at around $48 per share. From that point, the stock rallied to a recent pivot high at around $70. That’s an increase of nearly 46% that would make most growth-oriented investors smile; but does that also mean the stock has moved past the point of offering an attractive value as well? Let’s find out.
Fundamental and Value Profile
Citigroup Inc. (Citi) is a financial services holding company. The Company’s whose businesses provide consumers, corporations, governments and institutions with a range of financial products and services, including consumer banking and credit, corporate and investment banking, securities brokerage, trade and securities services and wealth management. The Company operates through two segments: Citicorp and Citi Holdings. Citicorp is the Company’s global bank for consumers and businesses and represents its core franchises. Citicorp is focused on providing products and services to customers and leveraging the Company’s global network, including various economies. As of December 31, 2016, Citicorp was present in 97 countries and jurisdictions, and offered services in over 160 countries and jurisdictions. Global Consumer Banking (GCB) provides traditional banking services to retail customers through retail banking, including Citi-branded cards and Citi retail services. C has a current market cap of $162.7 billion.
Earnings and Sales Growth: Over the last twelve months, earnings increased 22.5%, while sales increased almost 10%. Growing earnings faster than sales is difficult to do, and generally isn’t sustainable in the long-term; however it is also a good indication of management’s ability to maximize their business operations. The company’s Net Income versus Revenue tells an interesting story, since over the last twelve months it was actually -5.4%, but in the last quarter improved to more than 18.5%, pointing to major improvement in the company’s margin profile.
Free Cash Flow: C’s Free Cash Flow is strong, at more than $33.3 billion. This is a number that has increased throughout most of the past year and half, including an increasing from late last year at $21.5 billion, but before that point had declined from a high in late 2015 of about $65 billion.
Debt to Equity: C has a debt/equity ratio of 1.36, which appears high, but it should be noted that most banks carry higher debt levels as a normal course of their business. It should be noted that despite the high debt/equity ratio, the company’s cash and liquid assets are more than 3 times higher than the total amount of long-term debt on their balance sheet.
Dividend: C pays an annual dividend of $1.80 per share, which at its current price translates to a dividend yield of about 2.59%.
Price/Book Ratio: there are a lot of ways to measure how much a stock should be worth; but one of the simplest methods that I like uses the stock’s Book Value, which for C is $69.66 per share. At the stock’s current price, that translates to a Price/Book Ratio of .99, which at first blush seems very low; however, the stock’s historical average is only .78. The stock is also trading about 17% above its historical Price/Cash Flow ratio. Together, those two measurements put the stock’s fair value at somewhere between $54 and $58 per share, which is well below the stock’s current price. The stock would actually have to drop below $43 to be considered a useful discount relative to its historical Price/Book value.
Technical Profile
Here’s a look at the stock’s latest technical chart.
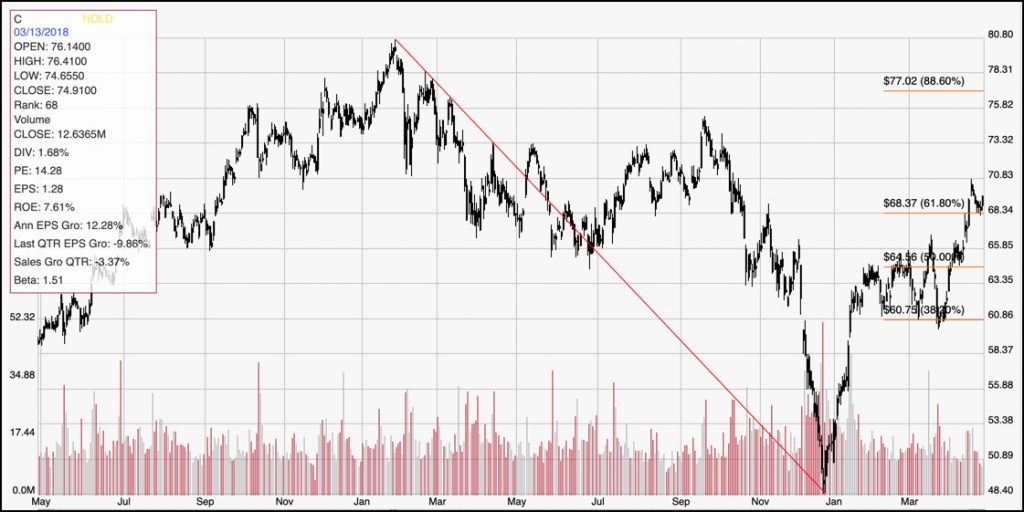
Current Price Action/Trends and Pivots: The chart above displays the stock’s price action for the last two years. The diagonal line traces the downward trend from January 2018 to its December low around $45. It also informs the Fibonacci retracement lines on the right side of the chart. From that low point, the stock has broken above the 61.8% retracement line around $68 per share. That’s a clear upward trend since the December bottom, and the break above $68 could be seen as a signal that upward trend is likely to continue, with room for the stock to run to around $75 in the near-term based on its September 2018 high. $68 also appears to be acting as support for the stock right now, which means that a break below $68 could be a signal the short-term trend is about to reverse to the downside, with room to drop to around $61, at the 38.2% retracement line before strong support is found.
Near-term Keys: C isn’t a good value pick at its current price; but if you prefer to take a growth-focused approach, there is an argument to be made, given the company’s fundamental strength and its upward trend this year, for buying the stock, even at its current levels. If you’re looking for a short-term trade, the best bullish signal will come from a break above the stock’s recent pivot high at $70 per share. That could be a good opportunity to buy the stock, or to start working with call options with an eye on $75 for a fairly quick profit target. If you want be a bit more speculative, a break below $68 could offer an interesting counter-trend trade by shorting the stock or working with put options, with an exit target in that case between $64.50 and $61 per share.