Like most sectors in the market this year, the Basic Materials sector has seen a sizable move to the upside. As measured by the S&P 500 Materials Sector SPDR ETF (XLB), the sector is up a little over 11% since the beginning of the year. This is a sector that operates with a fairly high degree of sensitivity to economic ebb and flow. In 2018, the sector was among those who showed a significant level of sensitivity to trade tensions, as a lot of the companies that make up the industry have connections to China.
Eastman Chemical Co. (EMN) is one of the biggest companies in the Chemicals industry. The stock has acted as a proxy for the effect of tariffs. In the company’s latest earnings report, management attributed broad-based declines in revenues and earnings in the last quarter versus the same quarter, a year ago including their pattern of the last couple of quarters specifically to trade concerns.
Those pressures have contributed to some other, less-than-stellar fundamental metrics as well, including increasing debt and decreasing liquidity. At first blush, that might be enough to make you want to leave the stock alone and perhaps check it out again in a few months; but there are also some indicators that look generally positive as well. The stock’s price has struggled, dropping from a high in June around $110 per share to a Christmas Eve low close to $67. The stock is a little more than 7% higher since January 1, but has also dropped about -4% in the last week. That price pressure has created some interesting value-based opportunities that I think make the stock worth paying attention. Let’s run the numbers.
Fundamental and Value Profile
Eastman Chemical Company (Eastman) is an advanced materials and specialty additives company. The Company’s segments include Additives & Functional Products (AFP), Advanced Materials (AM), Chemical Intermediates (CI), and Fibers. In the AFP segment, it manufactures chemicals for products in the coatings, tires, consumables, building and construction, industrial applications, including solar energy markets, animal nutrition, care chemicals, crop protection, and energy markets. In the AM segment, it produces and markets its polymers, films, and plastics with differentiated performance properties for end uses in transportation, consumables, building and construction, durable goods, and health and wellness products. The CI segment leverages large scale and vertical integration from the cellulose and acetyl, olefins, and alkylamines streams to support its specialty operating segments. Its product lines in Fibers segment include Acetate Tow, Acetate Yarn and Acetyl Chemical Products. EMN’s current market cap is $10.9 billion.
Earnings and Sales Growth: Over the last twelve months, earnings declined almost -21% while revenue dropped about -9%. Those numbers improved significantly in the last quarter; earnings increased a little over 27% while sales were flat, but slightly positive. The earnings growth is attributable to aggressive measures the company has made to reduce costs in response to the pressures they saw coming from from tariffs in 2018. The company’s margin profile is healthy, but also reflective of the same pressures; Net Income for the last twelve month was almost 10% of Revenues, with this number decreasing to about 9% in the most recent quarter.
Free Cash Flow: EMN’s free cash flow is healthy, at $1.1 million. This is a number that has increased significantly since 2017, from about $650 million.
Debt to Equity: EMN has a debt/equity ratio of 1.01, implying they use a fair amount of debt. The company’s balance sheet indicates their operating profits are more than adequate to service their debt for the time being, however liquidity could be a concern moving forward. Their balance sheet shows $195 million in cash and liquid assets versus about $5.9 billion in long-term debt.
Dividend: EMN pays an annual dividend of $2.48 per share, which translates to a yield of about 3.14% at the stock’s current price.
Price/Book Ratio: there are a lot of ways to measure how much a stock should be worth; but one of the simplest methods that I like uses the stock’s Book Value, which for EMN is $42.05 and translates to a Price/Book ratio of 1.86 at the stock’s current price. Their historical average Price/Book ratio is 2.46, suggesting the stock is undervalued by more than 31%. In addition, the stock is also trading 25% below its historical Price/Cash Flow ratio. Together, these two measurements offer a long-term target price between $98 and $103 per share.
Technical Profile
Here’s a look at the stock’s latest technical chart.
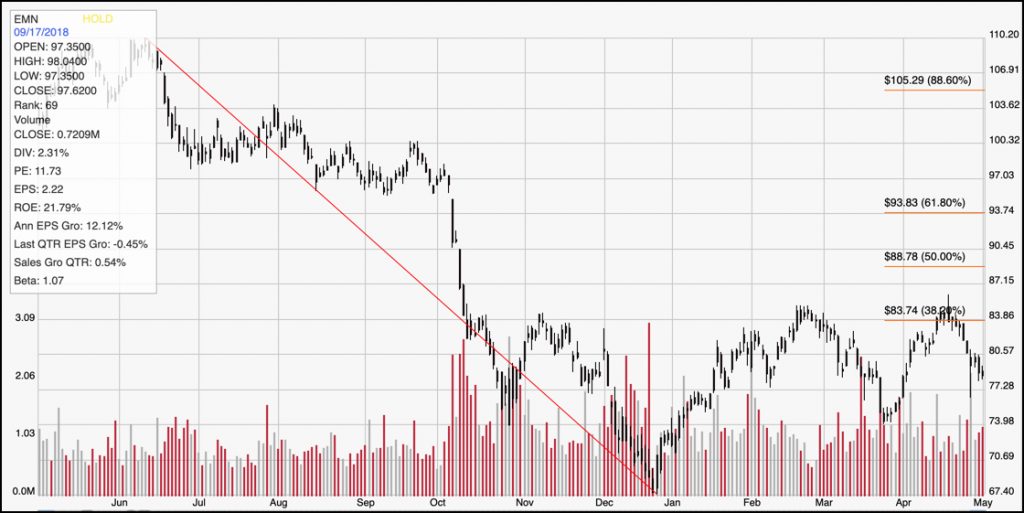
Current Price Action/Trends and Pivots: The diagonal red line traces the stock’s downward trend from June 2018 to the end of the year; it also provides the reference for calculating the Fibonacci retracement levels indicated by the horizontal red lines on the right side of the chart. EMN rose nicely from its low around $67, increasing about 20% to a high in the $84 range by late February. That peak, which also corresponds with the 38.2% Fibonacci retracement line, is now acting as resistance, with the stock showing bearish pressure right now as it is currently sitting a little above $78 per share. It has immediate support in the $74 range based on the most recent pivot low. A push above $84 would be needed to break the stock out of its current sideways pattern and provide enough momentum to start building any kind of sustainable upward trend. A break below $74 should give the stock plenty of room to drop and test its 52-week low around $68 per share.
Near-term Keys: The value proposition right now for EMN is very attractive, if you agree with the idea that the current holes in the company’s fundamental profile are temporary in nature. Since most of those problems are tied to trade, it makes sense that the sooner a trade agreement is reached, the sooner management should be able to reverse those troubling patterns. If the uncertainty associated with when, or even if such an agreement may be reached isn’t something you want to deal with, than even a deep discount like the one EMN is showing shouldn’t motivate you to take a long-term position. If you prefer to work with short-term trading strategies, the best approach would be to wait to see whether the stock can rally and break its current resistance at $84 to set up a good opportunity to buy the stock or work with call options; in that case, the 61.8% Fib line at about $94 would provide a good upside target price. A push below support at $74, on the other hand would be a good signal to consider shorting the stock or working with put options, with an eye on $68 as a bearish short-term profit target.