Within the scope of long-term investing, there are two primary methods most of us use: investing for growth, or looking for value. I write a lot in this space about value-oriented investing, because more than two decades of study and hard experience have taught me that it is the investing method that suits me best. One of the interesting things about my studies of the stock market is the way that most of us assume that working with one investing method excludes the use of any others. That usually means that the rules for one method don’t work for the other.
Growth and value methods generally don’t agree for one primary reason: growth investing likes to emphasize stocks at the top end of their historical price ranges. Stocks making new highs within an upward trend are usually taken as a positive for growth investors, particularly when the broad market’s trend is clearly bullish. With all of the major market indices pushing to a new set of all-time highs within the last week, I’m starting to see more and more commentary about the resumption of broadly bullish conditions.
Value investing prefers to focus on stocks that are working at the low end of their historical ranges; that increases the odds that the stock will represent a good bargain, particularly if the company’s fundamental profile is strong. Sometimes, however, a company that is plumbing those new lows can also show some interesting growth characteristics, particularly in its fundamental profile. For a value investor, that’s usually something that should make the stock even more interesting, because it suggests the long-term opportunity could be much better than even an optimistic value analysis may forecast.
Buckle Inc. (BKE) is just the kind of stock right now that I’m talking about. The stock has been following a long-term, multi-year downward trend and is only a few dollars above its lowest point in the last decade. That long-term trend is something that could make a lot of value-oriented investors a bit nervous; but this is also a company with zero debt, healthy liquidity and an operating profile that is gaining strength. It’s also a small-cap stock, which could help the stock pick up positive momentum even more than larger, more established companies. With the economy generally looking healthy and expected to continue to growth at a healthy rate into 2020, the long-term prospects for stocks in the Consumer Discretionary sector are looking more and more favorable, which means that BKE could be one of the best long-term opportunities the sector has to offer.
Fundamental and Value Profile
The Buckle, Inc. is a retailer of casual apparel, footwear and accessories for young men and women. As of January 28, 2017, the Company operated 467 retail stores in 44 states throughout the United States under the names Buckle and The Buckle. The Company markets a selection of brand name casual apparel, including denims, other casual bottoms, tops, sportswear, outerwear, accessories and footwear. The Company provides customer services, such as free hemming, free gift-wrapping, easy layaways, the Buckle private label credit card, and a guest loyalty program. The Company offers denims from brands, such as Miss Me, Rock Revival, Big Star Vintage, Buffalo Jeans, KanCan, Flying Monkey and Levi’s. Its other brands include Hurley, Billabong, Affliction, American Fighter, Fast & Furious, Oakley, Fox, Puma, Obey, RVCA, Salvage, 7 Diamonds, Nixon, Amuse Society, Free People, White Crow, Corral, Reef, Kustom, Timberland, UGG, TOMS, SAXX, Stance, Lokai, Ray-Ban, and Fossil. BKE’s current market cap is $934.1 million.
Earnings and Sales Growth: Over the last twelve months, earnings declined -3.45% while revenue decreased about -6%. Those numbers both turned dramatically more positive in the last quarter; earnings more than doubled, while revenues increased by nearly 23%. The stock’s operating profile over the last twelve months is very healthy, with Net Income more than 10.8% of Revenues. The number got even stronger in the last quarter, at 15.5%.
Free Cash Flow: BKE’s free cash flow is $98.86 million. This number translates to a healthy Free Cash Flow Yield of 10.5%.
Debt to Equity: BKE has a debt/equity ratio of, which is indicative of the fact the company operates with no debt. Their balance sheet also shows $220.2 million in cash and liquid assets.
Dividend: BKE pays an annual dividend of $1.00 per share, which translates to a yield of 5.27% at the stock’s current price.
Price/Book Ratio: there are a lot of ways to measure how much a stock should be worth; but one of the simplest methods that I like uses the stock’s Book Value, which for BKE is $8.04 and translates to a Price/Book ratio of 2.35 at the stock’s current price. The stock’s historical Price/Book ratio is 3.36 or nearly 43% below that average. The stock is also trading almost 24% below its historical Price/Cash Flow ratio. Together, both ratios offer a long-term target price in the $23.50 to $27 range. Those numbers are both a bit below the stock’s 52-week high point which is around $30 per share, Altogether, the stock’s value proposition looks very attractive.
Technical Profile
Here’s a look at the stock’s latest technical chart.
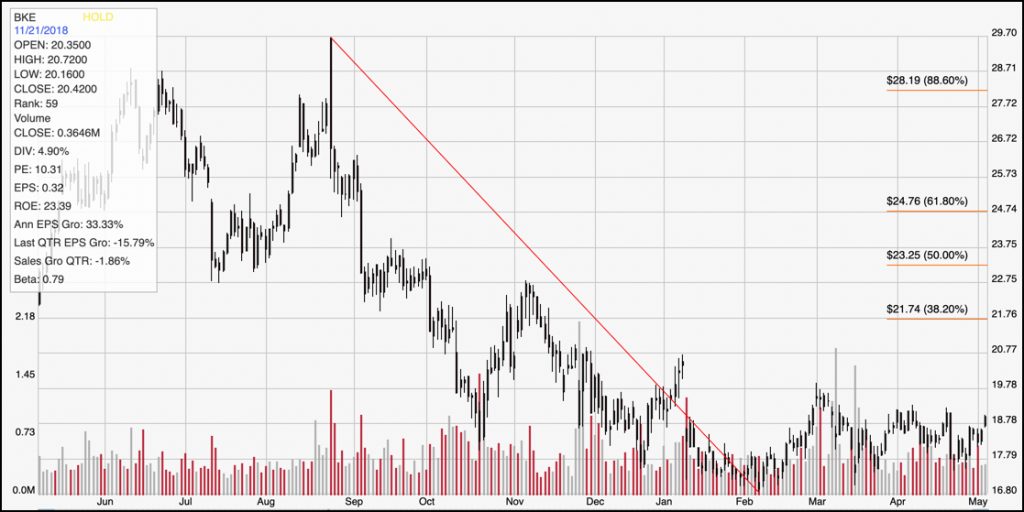
Current Price Action/Trends and Pivots: The diagonal red line traces the stock’s decline from August 2018 to a low point around $17 in early February; it also provides the reference for calculating the Fibonacci retracement levels indicated by the horizontal red lines on the right side of the chart. Since that February low, the stock has been hovering in a narrow, horizontal intermediate trend, with the stock consolidating between support around $17 and resistance around $19.44. In the last week, the stock has pushed near to that resistance level; a break above it could give the stock room to rally to a short-term high at a little below $22, where the 382.% Fibonacci retracement level rests.
Near-term Keys: The stock’s consolidation pattern right now is giving the stock an interesting reason to pay attention; it could be an early sign that the stock’s long-term downward trend could finally be set to reverse to the upside. With an excellent fundamental profile and a compelling value proposition, there is an argument to be made that the stock could push not only above its 52-week high, but from a growth standpoint, even higher. The stock’s all-time high came in July 2013 around $55 per share, and while I may not be willing to forecast a push back to those kinds of levels, it does make the $23.50 to $27 range pretty easy to accept. If you prefer to work with a short-term trade, look for a push above $19 as a signal for a good short-term bullish trade, either for buying the stock or working with call options with a near-term target around $22. On the other hand, a break below support at $17 could give the stock bearish momentum to test its multi-year low around $13, which certainly could be an interesting signal to short the stock or to consider buying put options.