I started out this week looking for stocks that are currently bucking the overall market’s bullish tone and trend right now. That’s a deliberately contrarian viewpoint that works off of the simple idea that stocks that are trading at or near low extremes offer a better bargain proposition than those that are surging to new highs. One of the top-performing sectors of the market this year is the Consumer Discretionary sector, which is up a little over 21% as of this writing, based on the movement of the S&P 500 Consumer Discretionary Sector SPDR ETF (XLY).
One of the reasons I think plumbing a high performing sector for underachievers is because at some point, the principle of “a rising tide lifts all ships” should apply to those stocks; that should be even more true for stocks whose performance contradicts a strong fundamental profile. One of those stocks in the Consumer Discretionary sector is Skechers U.S.A. (SKX). The stock’s performance has been unimpressive if you look at it fro the beginning of 2018; the stock hit a high in mid-April of last year at around $55 per share, but dropped back to a low around $22 by the end of the year. The stock then rode the broad market’s rally to a big three-month run, peaking a little above $35 before dropping back to its current price a bit above $30. That’s a decline of a little over 14% in about a month.
The company’s latest earnings report was received with pessimism, as the company cited global pressures tied to tariffs to account for declining earnings for the past year and unimpressive revenue growth. However, the company is also very disciplined in its ability to manage its balance sheet, and while their business could continue to see global headwinds to its business, not just from trade tensions that have yet to abate, but also from general softness being seen in the company’s value footwear core business, that does suggest that in the long-term, the stock should be able to weather its current difficulties. The stock does offer an intriguing value argument; is it worth adding to your own watchlist? You decide.
Fundamental and Value Profile
Skechers U.S.A., Inc. is a designer and marketer of Skechers-branded lifestyle footwear for men, women and children, and performance footwear for men and women under the Skechers Performance brand name. It also offers apparel, accessories, eyewear, scrubs and other merchandise. It sells its footwear in department, specialty and independent stores, as well as through its Skechers retail stores and online at skechers.com. The Company operates through three segments: domestic wholesale sales, international wholesale sales, and retail sales, which includes e-commerce sales. Its lifestyle brands include Skechers USA, Skechers Sport, and Skechers Active and Skechers Sport Active. Its Performance Brands include Skechers Performance, Skechers Kids and Skechers Work. As of December 31, 2017, the Company’s products are available in over 170 countries and territories through its network of subsidiaries in Asia, Europe, Canada, Central America and South America. SKX’s current market cap is $4.1 billion.
Earnings and Sales Growth: Over the last twelve months, earnings declined by a little over -2.67% while revenues improved nominally, at 2.13%. In the last quarter, earnings grew more than 135%, while sales improved by a little over 18%. The company also operates with a an improving margin profile, with Net Income running at about 6.25% of Revenues for the last twelve months, and 8.51% in the last quarter. It should be noted that all four of these numbers are significant improvements for the company compared to the latter part of 2018.
Free Cash Flow: SKX’s free cash flow is healthy, at a bit over $425.52 million. Free cash flow has also seen a big increase since the beginning of 2018, when it was only about $25 million. That is an interesting, and in my opinion important counter to the pattern of declining earnings I just referred to. Free Cash Flow is a harder number to manipulate for earnings reports, and for a lot of investors, including myself, is a more accurate representation of a company’s profitability than earnings per share. It also translates into a pretty healthy Free Cash Flow Yield of 8.44%.
Debt to Equity: SKX has a debt/equity ratio of .04. This number reflects the company’s very low debt levels, which were only $88 million as of the most recent quarter. By contrast, the company held more than $972 million in cash and liquid assets at the end of the quarter, emphasizing their solid financial base and excellent liquidity.
Dividend: SKX does not pay a dividend at this time.
Price/Book Ratio: there are a lot of ways to measure how much a stock should be worth; but one of the simplest methods that I like uses the stock’s Book Value, which for SKX is $14.26 per share and translates to a Price/Book ratio of 2.14 at the stock’s current price. Their historical average Price/Book ratio is 2.7. That suggests the stock is trading right now at a discount of about 26%, which puts the stock’s long-term target above $38.50 per share. Additionally, the stock is currently trading more than 34% below its historical Price/Cash Flow ratio, which translates to a target price at around $41. No matter which target you prefer to work with, SKX looks like a stock that offers an excellent bargain opportunity, with a sold fundamental profile to boot.
Technical Profile
Here’s a look at the stock’s latest technical chart.
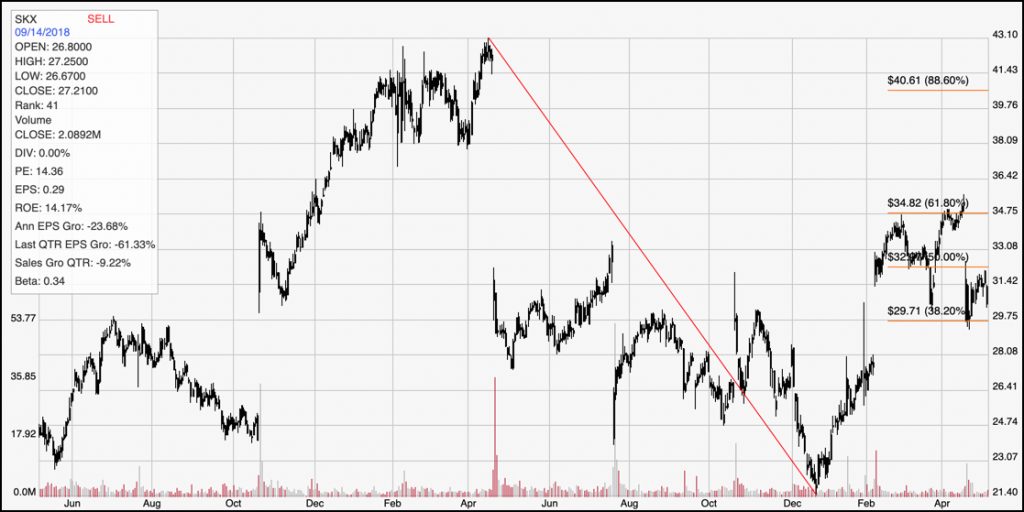
Current Price Action/Trends and Pivots: The red diagonal line measures the length of the stock’s downward trend from mid-April 2018 to its bottom at the end of the year; it also informs the Fibonacci trend retracement lines shown on the right side of the chart. The stock rallied high from trend low support at around $22 per share to a short-term peak a bit above $35 in early April, but more recently has retraced pretty sharply. The stock dropped all the way to support at the 38.2% Fibonacci retracement line, right around $30 a couple of weeks ago, and has been mostly consolidating since then between $30 and $31 per share. A break above $32 could mark a new surge in bullish momentum, with a break above $35 providing new confirmation of the stock’s upward trend since the beginning of the year. A break below $29.75, where the 38.2% retracement line current sits, could be an indication the stock is building a new wave of bearish momentum, with room to drop to around $25 in fairly short order.
Near-term Keys: If you’re a short-term trader looking for a good opportunity with this stock, you’re going to have to be patient. Trying to play the bullish side right now, given the stock’s current bearish momentum is very aggressive. If you are willing to be aggressive, look for a break above $32 as an opportunity to buy the stock or work with call options, with a target in the $35 to $36 range to close the trade quickly. If the latest round of saber-rattling from the Trump administration about tariffs carries the day, don’t be surprised to see the stock break below $30 per share, which could offer an interesting signal to short the stock or buy put options, with a near-term target between $26 and $25 per share. If, however you like the stock’s fundamental profile, believe that current trade pressures should resolve themselves in the long run, and are willing to exercise quite a bit of patience, the stock could be offering a compelling value opportunity right now.