Markets yesterday saw one of their most volatile days of the entire year so far, doubling down on trade uncertainty raised when a new tweet from President Donald Trump on Sunday threatened to impose $200 billion in new tariffs this Friday, raising current levels from 10% to the long-feared 25%. On Monday, the market tried to shrug off the tweet as just another rattle of Trump’s saber; but after administration officials said their Chinese counterparts reneged on certain areas of agreement Monday night, the market used that as fuel to stoke a fire that sent the S&P 500 plunging more than 1.5% in Tuesday’s session. At its lowest point, the index had dropped more than 50 points, or 1.73% before rallying somewhat before the close.
With most economic reports indicating that the U.S. economy remains healthy, and even seeming to quiet, although not entirely eliminate fears about global growth, trade remains the single biggest wild card to the market’s current momentum. It’s clear that investors have been pricing the expectation of a trade deal into the market throughout the year, and so it makes sense that anything that might tip this particular apple cart over is likely to cause a larger-than-normal downside reaction.
To be sure, all eyes are going to be on trade negotiations through the rest of the week; I think it’s fair to say that analysts and investors alike are going to brush aside any other market data until either a trade deal is reached, or new tariffs are actually enacted. Strap in, folks; I think the next three days are going to be a wild ride.
I still think that anybody that tries to make a prediction about where we will be at the end of the day on Friday is simply flipping a coin in the air; given the way this administration does things, led by a President who seems to relish his ability to be unpredictable and go against the grain of standard expectations, there is just no way to say for certain that we will or will not see a trade deal happen by the end of the week. The fact is that as of now, members of the Chinese trade delegation are still scheduled to arrive in Washington on Thursday, with some kind of new tariff announcement expected on Friday.
What does this mean for the market in general, and how much risk are we as investors looking at right now? As much as investors have been pricing in the expectation of a trade deal for the past four months, we now have to consider that the opposite is going happen – the market is going to try to discount that possibility now in case tariffs are, in fact increased. How do we draw a line in the sand for how far that discount might go? It’s hard to say for sure, simply because trying to predict where the market will find a top or bottom, over any time period, is really nothing more than sheer speculation no matter who you are. Even so, there are a few technical methods we can use to draw a few lines in the sand. Let’s look at the chart below.
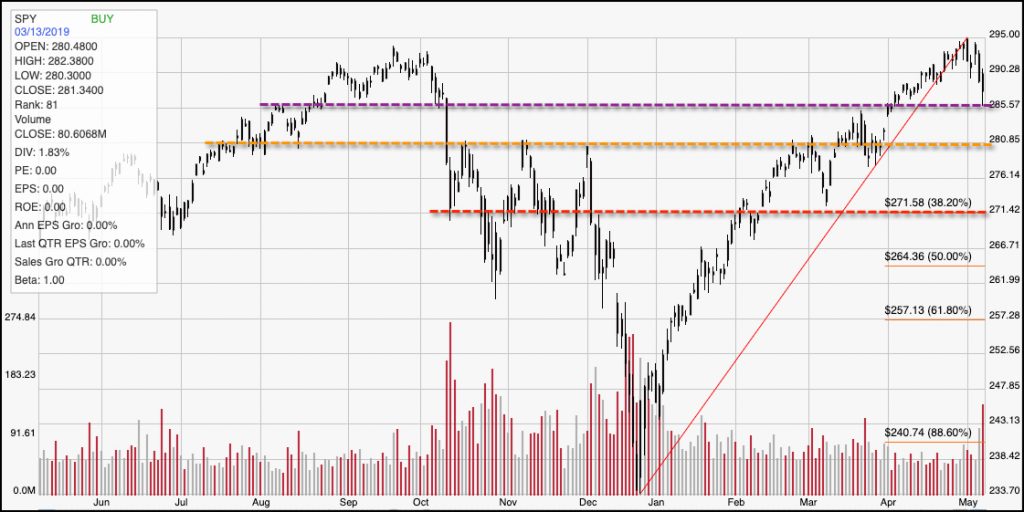
The chart above is for the S&P 500 SPDR ETF (SPY), which tracks and matches the movement of the S&P 500 index. The first technical method I tend to pay attention to when I start analyzing price movement, of either an index or a stock, are previous pivot high and low levels. That is what I’m using as the primary reference point for the purple and orange, dashed horizontal lines I’ve drawn. The purple line is less than -1% away from Tuesday’s closing level for the index, and is near to pivot levels dating back to August and September of last year – levels that proved to be the last support before the market finally turned to legitimate, bearish correction levels late in the year. It also means that more bad news – or at least badly received news – today could push the index straight through that line in short order.
The orange dashed line lines up with pivots in July, August, and October, November and December; the last three are interesting because they marked failure points for new attempted rallies in the midst of the market’s late-year corrective swoon. That level also provided temporary resistance in early March, and then support late last month, as the market rallied back to reclaim all of the distance lost in 2018’s late correction. That level is about -2.5% away from the market’s closing levels on Tuesday – not automatically out of range in a single day, but if the bearish tone continues, certainly within sight by Thursday.
The dashed red line is significant not only because it lines up with pivot points seen in October 2018, early February and again in March, but also because it falls nicely in line with the 38.2% Fibonacci retracement line I’m calculating using the index’s December low to its recent high just a few days ago. That line is about -5.5% away from the index’s Tuesday close, and almost 8% below its high point around $295.
The dashed red line represents the point that I think is the most important level to pay attention to in the short term. Expect the market to be volatile for the next couple of days, while speculation, rumor and innuendo push the market back and forth from one extreme to the next. I think that means that we’ll see a lot of movement around the purple and orange lines – both above and below. The real test is likely to come around the 38.2% retracement line, which coincides with about the 2,700 actual level for the index. Positive trade news should probably give the index a good reason to use that line as a good support level, which could actually set up an interesting ABC pullback pattern. In the context of the market’s bullish run to this point of 2019, that could be a very positive pattern for the market’s near-term strength.
On the other hand, if 25% tariffs do come into force on Friday, support in the area of that 38.2% should not be expected to hold. In that case, the market could easily retest its next most likely support around 2,600 (around $262 for SPY) very, very quickly. That does mean that there is downside risk in the broad market right now of more than 9% from Tuesday’s closing levels. That is near to new correction levels. Be very cautious right now before taking on new positions, and if you do, make sure that you keep your position sizing approach even more conservative than normal.