The market has been set on increasingly uncertain footing in the last two days as all of us try to figure out how the week is going to end between the U.S. and China and tariffs. The Trump administration continues to hold to their story that China reneged on previous agreements, but investors and analysts alike all seem to be holding on to the hope that a deal will be reached at the end of the week. While I believe the entire market is at risk if the U.S. follows through on the threat of increasing tariffs from 10% to 25% on Friday, industrial and tech stocks are probably the sectors that are stand to see the heaviest pressure.
While the broad market is down a little over -1.5% in the last two days – about the same as the Information Technology sector as measured by the S&P 500 Information Technology SPDR ETF (XLK) – Henry Schein Inc. (HSIC) is up nearly 8.5% in just the last two days. The company released its latest earnings report yesterday, and the market has apparently taken the information with overwhelming optimism. Even with the big surge in positive momentum – which includes a push off of a trend low at around $56.50 in March – the stock remains significantly below its 52-week highs a little below $92 per share.
The intriguing fact is that in the last month and a half, the stock has rallied more than $12 higher – about 20% over that period of time. Does such a big move portend a longer-term building trend to reclaim its yearly highs, or is it just a temporary pause in movement? The company has an interesting fundamental profile, with some elements of legitimate strength, and others that should generally be taken as red flags. The value argument for the stock, based on my favorite valuation metrics, is very intriguing. Is it something you should pay attention to? Let’s run through the numbers so you can decide for yourself.
Fundamental and Value Profile
Henry Schein, Inc. is a provider of healthcare products and services primarily to office-based dental and medical practitioners. The Company operates through two segments: healthcare distribution, and technology and value-added services. The healthcare distribution segment distributes consumable products, small equipment, laboratory products, large equipment, equipment repair services, branded and generic pharmaceuticals, vaccines, surgical products, diagnostic tests, infection-control products and vitamins. The technology and value-added services segment provides software, technology and other value-added services to healthcare practitioners. Its technology group offerings include practice management software systems for dental and medical practitioners. The Company provides its services to dental practitioners and laboratories, and physician practices, as well as government and institutional healthcare clinics. HSIC’s current market cap is $10.3 billion.
Earnings and Sales Growth: Over the last twelve months, earnings increased by almost 14.5% while revenues improved nominally, at 1.72%. In the last quarter, earnings grew nearly 8.5%, while sales improved by close to 3%. The company also operates with a narrow, but consistent margin profile, with Net Income running at about 4% of Revenues for the last twelve months, and 4.65% in the last quarter.
Free Cash Flow: HSIC’s free cash flow is generally healthy, at a bit over $594.07 million, which translates to a Free Cash Flow Yield of 5.48%.
Debt to Equity: HSIC has a debt/equity ratio of .28. This is a conservative number that I don’t believe tells the story properly by itself. The company’s balance sheet shows they could have liquidity issues, with only $80 million in cash and liquid assets against $1.16 billion in long-term debt. This means the company is relying almost exclusively on operating profits to service its debt; the fact is that their narrow margin profile doesn’t give them a ton of wiggle room, and while there is no indication they can’t service their debt, it does bear watching.
Dividend: HSIC does not pay a dividend at this time.
Price/Book Ratio: there are a lot of ways to measure how much a stock should be worth; but one of the simplest methods that I like uses the stock’s Book Value, which for HSIC is $23.23 per share and translates to a Price/Book ratio of 2.95 at the stock’s current price. Their historical average Price/Book ratio is 4.06. That suggests the stock is trading right now at a discount of a little over 37%, which puts the stock’s long-term target above $94 per share. Additionally, the stock is currently trading more than 70% below its historical Price/Cash Flow ratio, which translates to a target price at almost $117.
Technical Profile
Here’s a look at the stock’s latest technical chart.
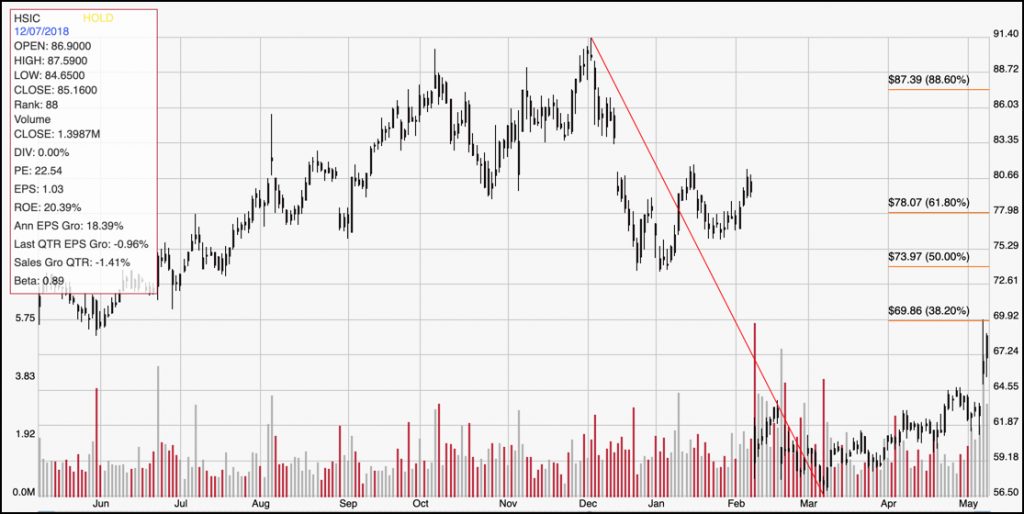
Current Price Action/Trends and Pivots: The red diagonal line measures the length of the stock’s downward trend from the beginning of December 2018 to its bottom at the end of the year; it also informs the Fibonacci trend retracement lines shown on the right side of the chart. The stock gapped down by nearly $20 per share overnight in the beginning of February before consolidating in a narrow range between trend low support near $56.50 and resistance at around $61 per share. HSIC finally broke above that resistance point in mid-April and at the beginning of this week broke above a new short-term high at around $65 per share. The stock is approaching resistance from the 38.2% Fibonacci retracement line near to $70 per share; but a break above that line would further validate the stock’s currently bullish momentum and give the stock room to keep filling the gap created by that February overnight plunge. The next resistance from that point would lie around the January pivot low which preceded that drop and that lies around $74 per share. The $65 level that the stock just broke above should now act as support, with the next support level below at around $61 if the stock’s momentum does fade.
Near-term Keys: From a short-term trading perspective, the stock is at something of a crossroads right now; it really isn’t giving clear signals right now to initiate either a bullish or bearish short-term trade. The best probability on the bullish side lies in a break above $70 per share; that could be an excellent to consider buying the stock or working with call options with an eye on the $74 mark as your exit target. If the stock drops below $65, you could consider shorting the stock or working with put options with a near-term target price at around $61. If you’re a value-oriented, long-term investor, and you like the stock’s fundamentals, the truth is that the value proposition for this stock is very interesting. Speaking for myself, the fundamentals look good enough to put the stock in a watchlist and start following it; I’m not certain that the company’s lack of liquidity and narrow margin profile make the stock a solid long-term value play as of yet. We’re still parsing some of the results from HSIC’s most recent earnings report, though, and so that viewpoint could shift.