At the beginning of 2018, I ran a complete analysis of Bed Bath & Beyond (BBBY), a stock that I’ve followed for some time, and used in the past for some of my own value-oriented investments. The stock has been in an extended, long-term downward trend dating back to the first quarter of 2015. That trend was driven by pressure on the stock’s fundamentals, including declining demand coming from shifting consumer trends – in particular to e-commerce. Like a lot of retail businesses that rely on traditional brick-and-mortar store, BBBY has been trying to shift its business and increase its revenues from its online presence – but while other companies like Kohl’s (KSS), BestBuy (BBY), Target Stores (TGT), and Walmart (WMT), to name just a few that have been able to find ways to combine an increasing push of their online presence with their traditional business models, BBBY has seen a major deterioration of its fundamental strength.
Since the beginning of the year, the stock has rebounded from a Christmas Eve low around $10.62 to its current level a little above $16. That’s a rally over the last five months of nearly 60%, which is incredibly impressive. When I ran my analysis of BBBY at the beginning of the year, I concluded that the holes in the stock’s fundamental profile were too big to justify the risk of making a value-based bet on the stock. Given the stock’s performance this year, some might be inclined to think my analysis and conclusion was wrong.
The problem with trying to work with a stock at the extreme low of a long-term downward trend is that if the trend is driven by fundamental problems such as those that have plagued BBBY, the risk that the stock will remain low, or drop even lower, is disproportionately higher than its chances of going higher. Even if the stock does rally, such as it has since January, if there isn’t a good fundamental basis for it, the risk remains higher, with no strong basis to suggest the stock should keep going higher. While a bit macabre, the term “dead cat bounce” is used to describe what can happen when a fundamentally poor stock reaches a temporary bottom. It may rally a bit higher on a temporary basis, but at some point will simply drop back to those historical lows or move even lower. So is BBBY’s rally a result of a major turnaround in the stock’s fundamentals, and so presenting a good new bullish opportunity, or is more likely to just be another dead cat bounce? Let’s find out.
Fundamental and Value Profile
Bed Bath & Beyond Inc. is a retailer, which operates under the names Bed Bath & Beyond (BBB), Christmas Tree Shops, Christmas Tree Shops andThat! or andThat! (collectively, CTS), Harmon or Harmon Face Values (collectively, Harmon), buybuy BABY (Baby) and World Market, Cost Plus World Market or Cost Plus (collectively, Cost Plus World Market). The Company operates in two segments: North American Retail and Institutional Sales. The Company sells a range of domestics merchandise and home furnishings. Domestics merchandise includes categories, such as bed linens and related items, bath items and kitchen textiles. Home furnishings include categories, such as kitchen and tabletop items, fine tabletop, basic housewares, general home furnishings, consumables and juvenile products. The Company operates approximately 1,530 stores plus its various Websites, other interactive platforms and distribution facilities. BBBY has a current market cap of about $2.1 billion.
Earnings and Sales Growth: Over the last twelve months, earnings declined -18%, while revenues dropped about -11%. The picture did saw a major improvement in the last quarter, as earnings increased by more than 5 times, while sales increased a little over 9%. The company’s margin profile, which was narrowing at the beginning of the year, has turned clearly negative; Net Income as a percentage of Revenues dropped to -7.65% in the last quarter versus -1.1% over the last twelve months. The decline of Net Income to negative territory while earnings have increased is something that I see as a direct counter to what a lot of people would read as an improving earnings profile. I believe this is a sign that the company’s turnaround efforts, in fact, are not working.
Free Cash Flow: BBBY’s free cash flow is very healthy, at $604 million over the last twelve months. That is a decrease since the beginning of the year, however from $753 million over the twelve months prior. The company’s Free Cash Flow Yield, by itself is also impressive, at 28.4%, but is also almost 50% lower from 47.5% at the beginning fo the year.
Debt to Equity: BBBY’s debt/equity ratio is conservative, at .58. The company’s balance sheet shows that long-term debt is a little less than $1.5 billion, while cash and liquid assets are a little below $1 billion. While their debt load has remained constant, their cash is about 20% below early 2018 levels. The company’s negative margin profile puts all of the declines I’ve outlined so far into perspective, implying that the company could be bleeding cash, since they clearly can’t service their debt from operating profits alone.
Dividend: BBBY’s annual dividend is $.68 per share, which translates to a yield of 4.23% at the stock’s current price. That is a very attractive yield, and could be an interesting draw to think about taking a long-term position if you think the stock’s current price still reflects a useful bargain.
Price/Book Ratio: there are a lot of ways to measure how much a stock should be worth; but one of the simplest methods that I like uses the stock’s Book Value. BBBY has a Book Value of $19.38, and like so many of its other fundamentals has dropped from levels at the beginning of the year at $21.02. That translates to a Price/Book ratio of .83, versus a historical ratio of 2.36. Forecasting a 284% increase in the stock’s price would put it near to $46 per share, which is a level the stock hasn’t seen since late 2015. I think that given the stock’s fundamental profile, there is no way to look for any kind of continued long-term basis for such a high price. The stock’s Price/Cash Flow ratio provides a more conservative forecast, since it is trading about 67% below its historical average and puts that target price around $27. That price level was last seen in late 2017.
Technical Profile
Here’s a look at the stock’s latest technical chart.
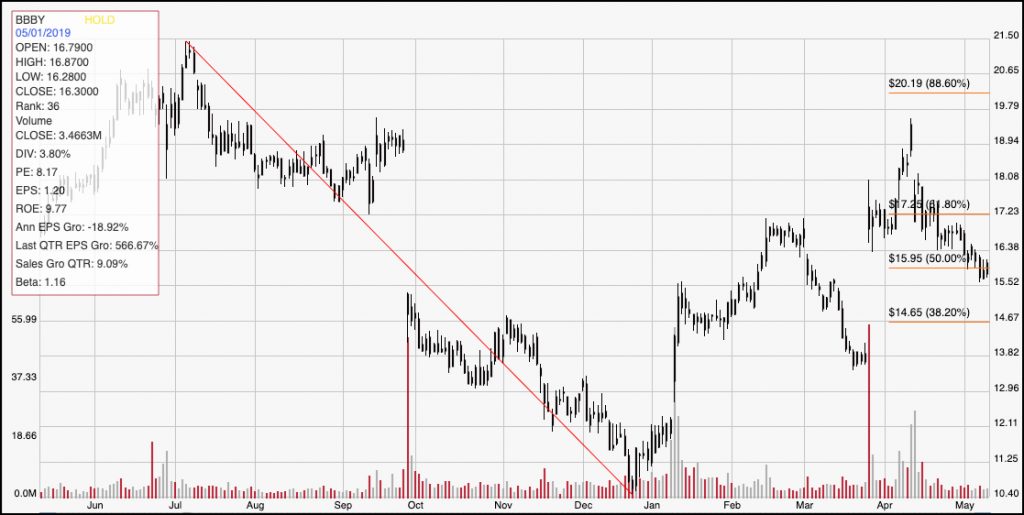
Current Price Action/Trends and Pivots: The red line on the chart traces the stock’s downward trend from a July high around $21.50 to its December low around $10.40. The stock’s rally from that point shows a lot of volatility, just as its drop from July does; that kind of volatility can make it hard to predict the stock’s short-term movements in any given direction. Currently the stock is sitting right on the 50% Fibonacci retracement line, with mostly bearish momentum that appears set to push it the price down near to the 38.2% retracement line around $14.65. The stock’s current price has filled a late-March gap to the upside by nearly half, which usually marks an important support point for the stock, but if the stock drops below its current level, I would expect the downward slide that began in early April to move even lower, including a test back to near its 52-week low.
Near-term Keys: Without any kind of basis for a bullish argument, even over a short-term period, the only real probability I can forecast for BBBY right now is bearish. If the stock drops below current support around $15.50, you could think about shorting the stock or working with put options with a near-term target at around $14 per share, a little below the 38.2% retracement line. If you’re willing to be a little more aggressive, you could wait to see if the stock will test that historical low around $10 per share.