Friday at 12:00 a.m., the Trump administration followed through on its threat to increase tariffs against China from 10% to 25%. Experts and pundits, including corporate heads, politicians, and economists seem united in the opinion that this latest phase of the trade war will be felt more acutely on the consumer level. The consensus seems to be that up to this point, corporate America has absorbed the increased costs from the 10% tariffs already imposed, which has mostly kept consumers shielded from those effects. That is less likely to happen now, meaning that these new costs will be passed through to the consumer level.
Increasing costs that filter all the way from production to consumption are almost certainly a strongly bearish economic indicator; whether this is something that could finally provide the tipping point that could mean the end of the longest expansion phase in more than 50 years remains to be seen. I certainly expect the market to continue to be volatile in the weeks ahead, as speculation about whether or not a final deal can be reached in any way before the new tariffs take effect continues to push the market back and forth between optimism and pessimism. I also believe that the sectors that will see the most volatility in the near term remain the industrial and technology sectors as they are the most directly affected by the relationship between the U.S. and China.
That brings me to the stock I’m highlighting today. When it comes to technology, I like the idea of looking for value in companies whose business model might not put them on the cutting edge of innovation, but does keep them in the segments that are going to keep everything else going. Enterprise technology refers to hardware, software, and technology services and solutions that drive business, and even if the broad economy falters, the truth is that technology’s place in the world’s economic fabric isn’t going away. Hewlett Packard Enterprise Co (HPE) is an example of a company that serves this specific segment. The stock is up about 12% on the year, but in the last month has dropped more than -9%, with most of that (-7%) coming in just the last week as reality set in that trade peace was not imminent as most expected. Does the prospect of continued trade tensions and the expected increased costs from tariffs mean that a company like HPE will be adversely affected in such a way that the stock is a bad risk right now, or is does it have the combination of fundamental strength and value proposition working for it that could make it worth the risk? Take a look and decide for yourself.
Fundamental and Value Profile
Hewlett Packard Enterprise Company is a provider of technology solutions. The Company’s segments include: Enterprise Group, Software, Financial Services and Corporate Investments. The Enterprise Group segment provides its customers with the technology infrastructure they need to optimize traditional information technology (IT). The Software segment allows its customers to automate IT operations to simplify, accelerate and secure business processes and drives the analytics that turn raw data into actionable knowledge. The Financial Services segment enables flexible IT consumption models, financial architectures and customized investment solutions for its customers. The Corporate Investments segment includes Hewlett Packard Labs and certain business incubation projects, among others. HPE has a current market cap of $20.3 billion.
Earnings and Sales Growth: Over the past year, earnings increased about 23.5%, while sales declined -1.5%. In the last quarter, earnings declined -6.7%, while sales dropped by almost -5% – numbers that I think are attributable, at least in part to the company’s exposure to international trade. The company operates with a significantly narrowing margin profile; over the last twelve months, Net Income was just 2.11% of Revenues, and was only 2.34% in the last quarter. By comparison, these numbers were 10.4% over the trailing twelve-month period versus to 5.8% in the last quarter at the end of 2018.
Free Cash Flow: HPE’s Free Cash Flow is healthy, at about $1.3 billion. On a Free Cash Flow Yield basis, that translates to 6.53%.
Debt to Equity: HPE has a debt/equity ratio of .56, which is a conservative number. Their balance sheet shows $3.7 billion in cash against $10.28 billion in long-term debt. Their balance sheet indicates their operating profits are adequate to service their debt, with good liquidity as well, but it should be noted that at the end of 2018, cash was about $5.5 billion.
Dividend: HPE pays a dividend of $.45 per share, which translates to an annual yield of about 3.04% at the stock’s current price.
Price/Book Ratio: there are a lot of ways to measure how much a stock should be worth; but one of the simplest methods that I like uses the stock’s Book Value, which for HPE is $13.38 per share. That is a decline from the end of 2018 at nearly $16 per share. At HPE’s current price, that translates to a Price/Book Ratio 1.1. The stock has actually only been trading publicly for about three years, which means that historical average ratios are less reliable; in this case I like to use the industry average as a reference point. The industry average Price/Book ratio is 3.5 and puts the top end of the stock’s long-term price target at around $46 per share. I think that is an extremely overoptimistic target, given that the stock’s all-time high is only at around $19 per share; however a better measurement comes using the stock’s Price/Cash flow ratio, which is currently trading nearly 65% below the industry average Price/Cash flow ratio. That translates to a more conservative, but still attractive target price at around $24 per share.
Technical Profile
Here’s a look at the stock’s latest technical chart.
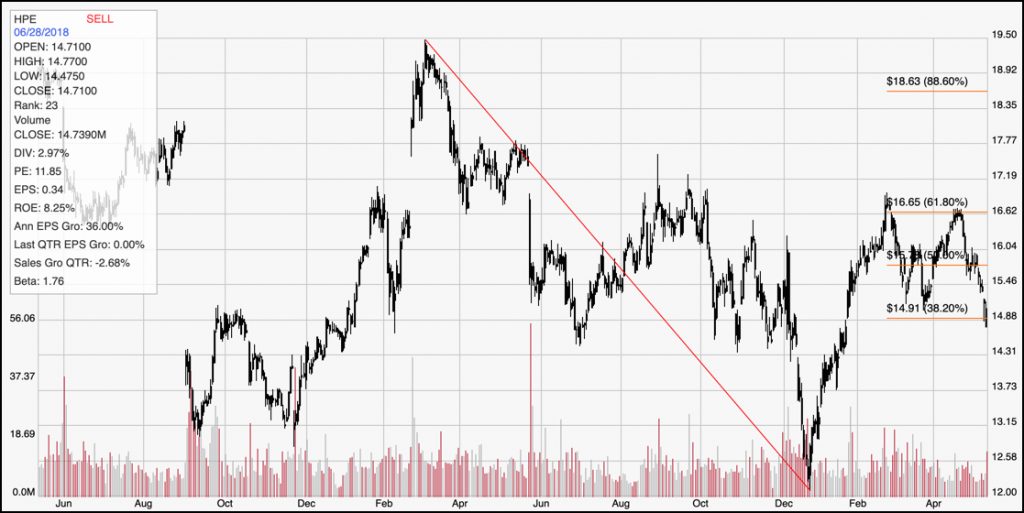
Current Price Action/Trends and Pivots: HPE’s downward slide from February to December of last year is easy to see. From that trend low at around $12, the stock rallied strongly, finding resistance more than 30% higher at around $16.65, where the 61.8% Fibonacci retracement line sits. From that peak in April, the stock has dropped back significantly, more recently pushing below support around the 38.2% retracement line at the end of the week. If the stock rallies back above that line, it could represent another bounce off of support with a drive upward to between $15.80 and $16.65; but if the stock keeps pushing low, the next mostly likely support point is around $13 per share, with the stock’s 52-week low around $12 not far off from that point.
Near-term Keys: If you don’t mind being aggressive, and little bit speculative, there could be an opportunity to buy the stock or work with call options if it can bounce off of support around at the 38.2% retracement line and push higher. In that case, be ready to take profits quickly between $15.80 and $16.65 per share. A bearish trade using put options or shorting the stock isn’t really a very practical trade unless it continue to follow through on its currently bearish momentum. The stock has about $1.79 in room to its next support point, with another dollar if you prefer to use the 52-week low as an exit target. From a value perspective, the stock is interesting; however I also believe that current geopolitical conditions make taking a position in this stock a greater risk than it worth. A smarter approach from a value perspective would be to give the stock, and the market some time to sort through current trade issues and find a new equilibrium, and then redo your analysis with a fresh set of eyes.