It seems that the only news anybody really cares about right now is the trade war. China announced yesterday that it would impose $60 billion of retaliatory tariffs against the U.S. after the Trump administration increased already imposed duties from 10% to 25% at the end of last week. That has propelled the market to a decline in the S&P 500 index of nearly 5% since the beginning of the month – with the biggest portion of that drop coming in the last three days. Is it finally time for investors to be running for the exits? Is this the proverbial straw that finally breaks the camel’s back after a decade of nearly uninterrupted prosperity and growth?
There are certainly no lack of fear-mongers and naysayers out there that would like you to believe just that; and I do think that at least some of what we’re seeing is the inevitable drawdown of a bull market run that until this month has seen massive rally since bottoming on Christmas Eve 2018. From that point, as measured by the SPY, the ETF that tracks the S&P 500, the market is still up nearly 17% in less than six months – and that is still taking into consideration the market’s drop since the beginning of May. Could the drop extend even further? Certainly; the more the U.S. and China keep sniping at each other and a deal isn’t reached, the more on edge the market will remain, and I believe that instead of pricing in the expectation of a deal, as has happened until now, we may see investors begin discounting the market based on the fear of the worst.
This kind of uncertainty is one of the reasons that I like to try to pay attention to stocks that are already trading at the lower end of their historical ranges; while it isn’t a given they won’t continue to go down if the overall market is bearish, the fact is that these kinds of stocks are generally far less at risk for the kind of free-fall to which I believe other stocks you’ll find coming off of all-time highs right now are staring directly in the face.
That leads me to the stock I’m focusing on today. Gilead Sciences Inc. (GILD) is a large-cap biopharmeceutical stock with a major presence in some of the most cutting-edge areas of bioscience. The stock is more than -28% off of the high it reached at the beginning of 2018, and is in a long-term downward trend from that point; but it also looks like that trend is starting to flatten out, and the stock is showing very strong support only a few dollars below the stock’s current price. The stock has some interesting elements showing a significant level of strength, however, including a very strong balance sheet. Does the stock’s relatively low current price, and fundamental strength create a compelling value? Let’s take a look.
Fundamental and Value Profile
Gilead Sciences, Inc. is a research-based biopharmaceutical company that discovers, develops and commercializes medicines in areas of unmet medical need. The Company’s portfolio of products and pipeline of investigational drugs includes treatments for Human Immunodeficiency Virus/Acquired Immune Deficiency Syndrome (HIV/AIDS), liver diseases, cancer, inflammatory and respiratory diseases and cardiovascular conditions. Its products for HIV/AIDS patients include Descovy, Odefsey, Genvoya, Stribild, Complera/Eviplera, Truvada, Emtriva, Tybost and Vitekta. Its products for patients with liver diseases include Vemlidy, Epclusa, Harvoni, Sovaldi, Viread and Hepsera. It offers Zydelig to patients with hematology/oncology diseases. Its products for patients with various cardiovascular diseases include Letairis, Ranexa and Lexiscan. Its products for various inflammation/respiratory diseases include Cayston and Tamiflu. It had operations in more than 30 countries, as of December 31, 2016. GILD has a current market cap of $81.8 billion.
Earnings and Sales Growth: Over the past year, earnings increased almost 22%, while sales increased modestly, at 3.79%. In the last quarter, earnings increased a little more than 24.57%, while sales dropped by almost -9%. The company operates with a very healthy margin profile that appears to be getting even stronger; in the last twelve months, Net Income was more than 26% of Revenues, while in the last quarter that number increased to just over 37%.
Free Cash Flow: GILD’s Free Cash Flow is generally healthy, at about $6.6 billion. On a Free Cash Flow Yield basis, that translates to 7.92%. It should be noted that this number has declined steadily since the beginning of 2016, when Free Cash Flow peaked at $19.5 billion. This is a red flag, but given some of the other numbers I’m about cover I don’t believe it is a major cause for concern.
Debt to Equity: GILD has a debt/equity ratio of 1.09, which is a bit higher than I prefer to see; but by itself this number doesn’t really tell the whole story. Their balance sheet shows almost $28 billion in cash against $24 billion in long-term debt. Along with their very strong margin profile, this is a good indication that the company has plenty of financial flexibility, not only to service their debt, but also keep funding the strategy they’ve been following for a while, which is to grow earnings via acquisition, and returning value to shareholders via stock buybacks and dividend payouts..
Dividend: GILD pays a dividend of $2.52 per share, which translates to an annual yield of about 3.84% at the stock’s current price.
Price/Book Ratio: there are a lot of ways to measure how much a stock should be worth; but one of the simplest methods that I like uses the stock’s Book Value, which for GILD is $17.37 per share. Their historical Price/Book ratio is 5.3, which actually means GILD is currently trading at a discount of almost 44% from par with that average. That’s pretty compelling, and could make GILD a very interesting stock to watch, even under current market conditions.
Technical Profile
Here’s a look at the stock’s latest technical chart.
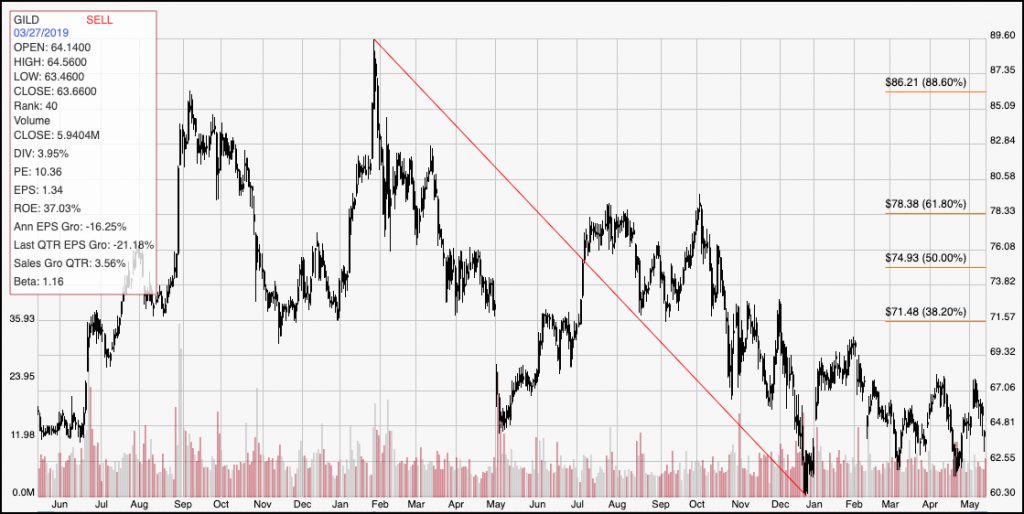
Current Price Action/Trends and Pivots: GILD’s downward slide from January 2018 to December of last year is easy to see. From that trend low at around $60, the stock rallied to about $70 by the beginning of February, but then dropped back again. Since the beginning of March, the stock has begun to define a consolidation range, with top-end resistance at around $67 and support around $62. A break above $67 could mark an early indication that the downward trend could be reversing back to the upside, with room to run to the 38.2% Fibonacci retracement line shown at around $71.50 in the near term.
Near-term Keys: Given current market conditions, it may seem a little odd to suggest that a bearish, short-term trade on GILD Is a low-probability risk right now; but the fact is that unless the stock breaks its multi-year low around $60, its downward trend is unlikely to extend much further. That doesn’t mean that it won’t break that level; that is always a possibility. The stock’s consolidation range right now, however, and the fact that it is extending into a time range of near three months right now, provides an increasing likelihood the stock is setting up for a major bullish reversal. Even so, the best signal for a bullish short-term trade on the stock won’t be seen unless the stock breaks above $67 per share; if that happens, you should take it as a good signal to buy the stock, or to work with call options with a near-term exit price in the $71.50 range. What about the stock’s long-term prospects? The value proposition is very intriguing; and if you aren’t afraid of a fair amount of volatility, both from the stock and the broad market right now, this is a stock that offers an impressive dividend yield for those who are willing to be patient and hold on for the ride.