The market rallied strongly yesterday; I guess that shouldn’t have been too much of a surprise, since investors are apparently so fearful of the prospect of what an extended escalation of the trade war that the entire market seems to be hanging on every tweet or sound bite that comes from the White House or China. Trump raises tariffs to 25% on Friday – market drops. China retaliates by increasing their tariffs on Monday – market drops. But what, says Trump – there’s still a chance a good deal can be made! Market rallies.
Uncertainty centered around geopolitical issues that bleed into the global economic picture are always going to result in a higher than normal degree of volatility for the financial markets, which is why I started this post by saying that the market’s rally yesterday – which exceeded 1% at its highest point – wasn’t really too surprising. I think that as long as that uncertainty persists, the market is going to swing violently from high to low as news continues to speculate on either the success or failure of both sides to find a compromise.
Stocks on the bleeding edge of international trade are the ones that naturally stand to lose the most, and it certainly seems that tech stocks are among the most exposed to that risk. Semiconductor stocks, in particular seem to be in a position to take the brunt of a lot of market tension, since their major portions of these company’s revenue streams come from China. Does that mean that a smart investor should stay away from tech and semiconductor stocks until there is more clarity to be seen? That’s a tough question, because stocks like Applied Materials Inc. (AMAT) seem to have a lot going for them right now on the fundamental side of things. The dilemma about the opportunity AMAT offers isn’t just confined to trade tensions, either; depending on which valuation metric you prefer to work with, the stock could be slightly overvalued, or still running at a discount of almost 50% despite the fact that the stock has rallied a little over 38% so far this year. To some extent, then beauty is in the eye of the beholder. Let’s take a look so you can see what I mean.
Fundamental and Value Profile
Applied Materials, Inc. provides manufacturing equipment, services and software to the global semiconductor, display and related industries. The Company’s segments are Semiconductor Systems, which includes semiconductor capital equipment for etch, rapid thermal processing, deposition, chemical mechanical planarization, metrology and inspection, wafer packaging, and ion implantation; Applied Global Services, which provides integrated solutions to optimize equipment and fab performance and productivity; Display and Adjacent Markets, which includes products for manufacturing liquid crystal displays, organic light-emitting diodes, upgrades and roll-to-roll Web coating systems and other display technologies for televisions, personal computers, smart phones and other consumer-oriented devices, and Corporate and Other segment, which includes revenues from products, as well as costs of products sold for fabricating solar photovoltaic cells and modules, and certain operating expenses. AMAT has a current market cap of $38 billion.
Earnings and Sales Growth: Over the last twelve months, earnings dropped by -23.5%, while sales declined by almost -11%. Despite these declines, the company’s margin profile remains impressive; Net Income versus Revenue was more than 20% in the last quarter, which is very strong – but it should be noted that over the last twelve months that number is a little over 23%. The comparative decline, I believe is a reflection of the effect of tariffs up to this point, which also suggests that continued, increased tariffs could see these numbers drop even more.
Free Cash Flow: AMAT’s Free Cash Flow is strong, at more than $2.6 billion. While this number declined from about $7 billion at the beginning of 2018, it is also up slightly from its level around $2.5 billion at the end of 2018.
Debt to Equity: AMAT has a debt/equity ratio of .65, which is conservative, and implies debt management shouldn’t be a problem. The company has about $3.7 billion in cash and liquid assets, which means they they have plenty of liquidity, against $5.3 billion in total long-term debt.
Dividend: AMAT pays an annual dividend of $.84 per share, which at its current price translates to a dividend yield of about 2.1%. It should be noted that the company increased its dividend in the last quarter by 5% annually, from $.80 per share.
Price/Book Ratio: there are a lot of ways to measure how much a stock should be worth; but one of the simplest methods that I like uses the stock’s Book Value, which for AMAT is $8.65 per share. At the stock’s current price, that translates to a Price/Book Ratio of 4.62. The stock’s historical average is 4.38. That is a pretty good indication the stock could be overvalued right now by about -5.3%. A move to par with its historical average would put the stock a little below $38 per share. By contrast, the stock is also trading almost 50% below its historical Price/Cash Flow levels, which translates to a long-term target price in the $79 range. How do you resolve the difference? I think a little, additional historical perspective is useful; at the end of last year, AMAT’s Book Value was $6.96 per share, and both Price/Book and Price Cash Flow analysis were offering long-term targets between $28 and $60 per share. There is still a wide range between the levels offered by each type; but they are also both trending upward, which suggests the value proposition could lean more to the Price/Cash Flow side. Another way to think about it is in terms of reward: risk. If the Price/Cash Flow forecast is correct, the stock has more than $38 of upside, while if the Price/Book is more accurate, the downside is about $4 right now. That’s a reward: risk ratio of more than 9:1 – something that most traders will tell you is very interesting.
Technical Profile
Here’s a look at the stock’s latest technical chart.
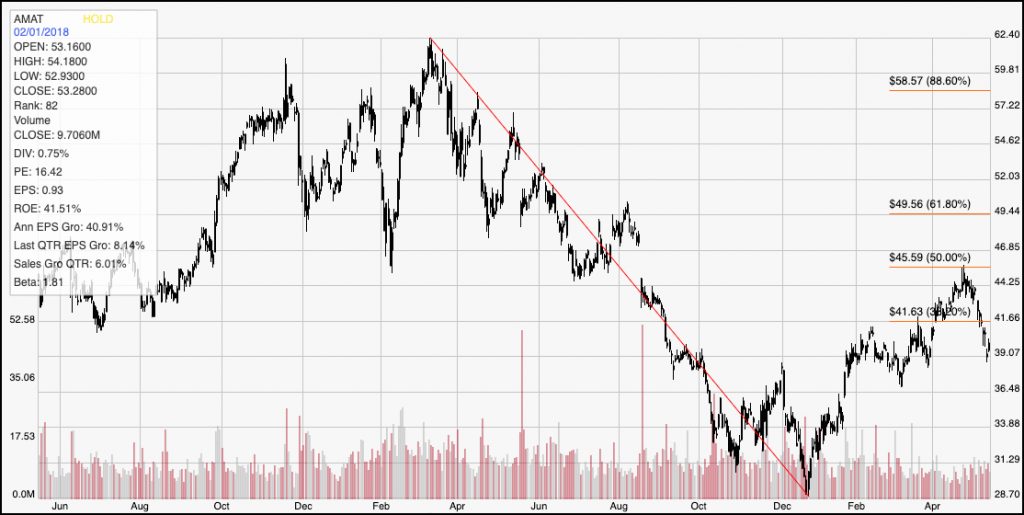
Current Price Action/Trends and Pivots: The chart above covers the last two years because I want to give you an idea of how far AMAT has come. The red line traces the stock’s downward trend from March to December 2018, and informs the Fibonacci retracement lines on the right side of the chart. From the trend low at around $29, the stock has rallied a little over 38% higher, but after peaking at about $45, it has lost a big chunk of that momentum, declining a little over -14% in the last month. Most of that decline can be attributed to concerns about tariffs, and the bearish momentum has pushed the stock below the 38.2% retracement line and near to its next closest support level, which is around $37 per share based on pivot lows in early March. A break below that level could see the stock drop to around $31, or possibly to the $29 to retest those trend lows. The stock would need to break above $45 to offer any kind of confirmation of its intermediate upward trend, but a break back above $42 and the 38.2% retracement line could mark a reversal of the short-term downward trend.
Near-term Keys: If you like working the short side of the market, the strength of the downward trend might make a bearish trade look tempting right now; but the smart move is to wait and see if the stock will break the $37 support level I just mentioned. That could offer a pretty interesting bearish trade with a profit target around $31. Current short-term momentum isn’t working in the favor of a bullish trade; but if the stock can break above $42, there could be an interesting to buy the stock or work with call options with a short-term target price at around $45. What about the value proposition? I lot of that depends on your perspective about the prospect for the stock in the long-term, as well as your ability to tolerance near-term risk, not only in the stock but also to trade concerns. It should also be noted the company is due to release its latest earnings report later today, which means that investors will have a fresh set of data to mull over. That information will certainly be illuminating one way or another, as will any observations management offers about its future forecast.