Trade war, trade war, trade war…it really seems like investors are discounting all other information in favor of the next sound bite or tweet from the Trump administration or from China. After ending last week with a big sell off, and starting this week on the same note, the market is hyper-aware and super-sensitive to any hints of progress, or drawbacks in trade negotiations. A couple of days ago President Trump announced he would delay increasing auto tariffs, and the market took the news as a reason to rally back even harder than it had sold off; indeed, for the week the market was up about 1% as of last night’s closing bell.
Will it last – who knows? Analysts and investors alike all seem to be trying to hold fast to the expectation that a deal will ultimately be reached – and I do agree that it doesn’t seem to make sense for tariffs and trade tensions between the two largest economies in the world to continue as they are long-term. In the meantime, the companies and stocks with the most exposure to trade tensions are the ones that I think will see the most volatility.
Tech stocks, and semiconductors more specifically, have a pretty big level of exposure, and a keenly vested interest in trade peace between the U.S. and China. I think one of the things about the semiconductor industry that makes sense to pay attention in these kinds of conditions aren’t just the major names in the industry, but also the businesses that provide those companies with the services and solutions they need. KLA-Tencor Corporation (TLAC) is a company that I think makes a lot of sense to keep in a watchlist right now. Like AMAT, this is a stock that supplies the semiconductor industry with the tools it needs to produce its products and goods. The stock rallied strongly from the beginning of the year until the end of May, going from a 52-week low around $80 to a peak at about $129 per share. The stock has dropped 15% from that high point since then, but appears to be settling in at an interesting support level now. Does that drop open up a good value-based opportunity for patient investors that aren’t afraid of a little volatility in the near-term? Let’s take a look.
Fundamental and Value Profile
KLA-Tencor Corporation (KLA-Tencor) is a supplier of process control and yield management solutions for the semiconductor and related nanoelectronics industries. The Company’s products are also used in a number of other high technology industries, including the light emitting diode (LED) and data storage industries, as well as general materials research. Its products and services are used by bare wafer, integrated circuit (IC), lithography reticle (reticle or mask) and disk manufacturers around the world. The Company’s inspection and metrology products and related offerings are categorized in various groups, including Chip Manufacturing, Wafer Manufacturing, Reticle Manufacturing, LED, Power Device and Compound Semiconductor Manufacturing, Data Storage Media/Head Manufacturing, Microelectromechanical Systems (MEMS) Manufacturing, and General Purpose/Lab Applications. It also provides refurbished KLA-Tencor tools as service and support for its products. KLAC’s current market cap is $17.7 billion.
Earnings and Sales Growth: Over the last twelve months, earnings declined almost -11% while revenues increased about 7.5%. In the last quarter, earnings dropped a little over-26%, while sales also declined by about -2%. This pattern is a reflection of industrywide pressure coming from declining demand in the memory market, where supply remains very high. This is a headwind that most industry experts expect to persist into 2020, and could keep stock prices muted. Despite this fact, KLAC operates with a very strong margin profile, with Net Income running at almost 30% of Revenues over the last twelve months, but decreasing in the last quarter to 17.5%. Even with the decline, the company’s operating margins are very healthy.
Free Cash Flow: KLAC’s free cash flow is healthy, at a little more than $1.1 billion and translates to a useful Free Cash Flow Yield of 6.18%.
Debt to Equity: KLAC has a debt/equity ratio of 1.1. At first blush, that seems a little high; but a look at the company’s balance sheet provides a better perspective and shows that their debt is very manageable. The company has almost $1.9 in long-term debt, but about $3.1 billion in cash and liquid assets as of the last quarter. Along with their very impressive operating margins, this means that the company has both the ability to service their debt without difficulty, as well as excellent liquidity and financial flexibility.
Dividend: KLAC pays an annual dividend of $3 per share, which translates to a yield of about 2.76% at the stock’s current price.
Price/Book Ratio: there are a lot of ways to measure how much a stock should be worth; but one of the simplest methods that I like uses the stock’s Book Value, which for KLAC is $17.85 per share. This marks an impressive increase from the beginning of the year, when the Book Value was just $10.24; it also translates to a Price/Book ratio of 6.09 at the stock’s current price. That seems high for n investor like me, that generally prefers to see ratios as close to 1 as possible; but their historical average Price/Book ratio is 15.12, which suggests the stock is trading right now at a discount of about 59%. That may seem very optimistic, especially since it puts a long-term target price at nearly $269 per share. The stock’s all-time high was reached in March of last year around $124 per share, so I do think this is probably over-optimistic. The stock’s Price/Cash Flow ratio provides a more conservative target since the stock is trading just about 14% below that historical average and puts the stock’s long-term target at a more reasonable $124. Is that enough upside to make the stock worth taking a position right now? I’m not sure; but I also think the stock’s current momentum could keep pushing the stock lower, and that is something that would be interesting, since a useful value-based price is not too far away at about $99.
Technical Profile
Here’s a look at the stock’s latest technical chart.
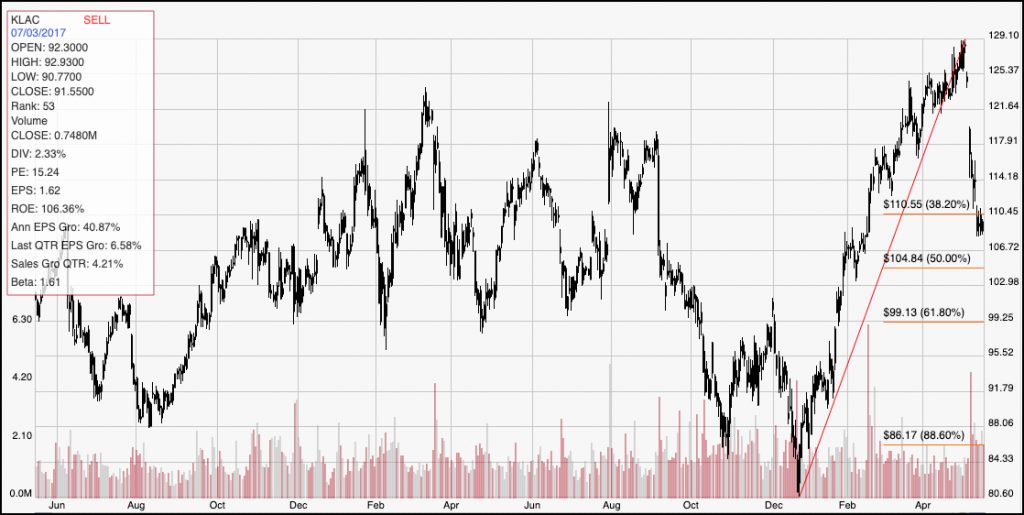
Current Price Action/Trends and Pivots: The red diagonal line measures the length of the stock’s upward trend from December last year to the beginning of May; it also informs the Fibonacci trend retracement lines shown on the right side of the chart. The stock recently pushed below the 38.2% Fibonacci retracement line, but appears to finding good support in the $108 price area. If this current support breaks down, I believe the next most likely support is around $99, where the 61.8% retracement line sits.
Near-term Keys: If you’re looking for a short-term bullish trade, you should wait for a break above $110.50 before trying to buy the stock or work with call options; until that happens, you should expect the downward trend’s overall strength to work against your probabilities of success. If the stock does find a reason to drop below $108, it should find short-term support around $99 per share based on the 61.8% retracement line and multiple pivot low points around that level in 2018. A drop below $108 could be a good signal for a put option trade or to short the stock, with a target price at $99 per share. While I’m not sold on the value proposition at the stock’s current price, I do think that if the stock drops to the 61.8% retracement line, there is a much better case to be made for a long-term bullish position at that point.