Monday marked the beginning of a new chapter in the trade war between the United States and China that is beginning to ripple clearly into the market. Before the market opened, analysts were surprised by the announcement that tech giants Alphabet (GOOGL) and Qualcomm (QCOM) were taking steps to cut off Chinese telecomm behemoth Huawei Technologies’ access to their products. That move followed the Trump administration’s Friday blacklisting of Huawei from buying American-made telecommunications parts and components. Late Monday, the administration seemed to ease the restriction somewhat, allowing the company to purchase American-made goods to maintain existing networks and handsets while keeping in place the original restriction on purchases for new products without license approvals.
The announcement from GOOGL and QCOM put the entire semiconductor sector on notice on Monday, with the sector dropping nearly 4% on the day as measured by the Philadelphia Stock Exchange iShares Semiconductor ETF (SOXX). Most of the indications we’ve been seeing of trade war effects in corporate America have come from earnings reports tariffs impact revenues and profitability; this is the first move from corporate America itself (in compliance with the federal statute, of course) that will clearly put a big lid on those company’s access to the Chinese market. To what extent will this reverberate in the long term remains unclear, but it certainly seems to indicate that semiconductor stocks, while in many cases approaching attractive valuation levels, are likely to remain under significant bearish pressure for the time being.
One of the biggest losers in the semiconductor industry since the beginning of 2018 is NXP Semiconductors NV, a Netherlands-based, large cap semi stock with deep penetration in a variety of markets, including the automotive industry. Concerns about trade tensions between China and the U.S. kept China from granting regulatory approval for a proposed merger between NXPI and QCOM in July 2018; concern that the deal would ever be approved led investors to start selling the stock in late February 2018 from a peak at around $126 per share and pushing it nearly -50% lower before it finally bottomed in December at about $68. The stock followed the rest of the market nicely higher from that point before peaking at the beginning of May at $108 per share, but as trade tensions have increased the the stock appears set to begin a free fall. It’s down -16.6% in the last three weeks, and the fact is that with a significant level of exposure to Chinese risk across multiple customer industries, the stock could be at risk of an even bigger drop. There are also some cracks that are starting to show in the stock’s fundamental profile that should raise concern. Let’s take a look.
Fundamental and Value Profile
NXP Semiconductors N.V. (NXP) is a holding company. The Company operates as a semiconductor company. The Company provides high performance mixed signal and standard product solutions. The Company’s segments are High Performance Mixed Signal (HPMS), Standard Products (SP), and Corporate and Other. Its product solutions are used in a range of end-market applications, including automotive, personal security and identification, wireless and wireline infrastructure, mobile communications, multi-market industrial, consumer and computing. It engages with global original equipment manufacturers (OEMs) and sells products in all geographic regions. NXP’s HPMS segment includes business lines, such as Automotive, Secure Identification Solutions (SIS), Secure Connected Devices (SCD), and Secure Interfaces and Infrastructure (SI&I). The Company’s SP segment supplies a range of standard semiconductor components, such as small signal discretes and power discretes. NXPI has a current market cap of $30.4 billion.
Earnings and Sales Growth: Over the last twelve months, earnings increased by 81%, while sales decreased about -7.7%. These numbers deteriorated in the last quarter, with earnings dropping more than -16% and sales almost -13%. This negative earnings pattern is also bleeding into the company’s margin profile; over the last twelve months, Net Income was an impressive 23% of Revenues, but the number dropped drastically in the last quarter and is actually negative, at -1% in that time period.
Free Cash Flow: NXPI has generally healthy free cash flow of about $3.5 billion over the last twelve months. This number translates to a Free Cash Flow Yield of 11%, which is attractive.
Debt to Equity: NXPI has a Debt/Equity ratio of .63, which is relatively conservative. Their balance sheet indicates the company has about $2.2 billion in cash and liquid assets against $6.2 billion in long-term debt. While their ability to service their debt isn’t a concern at this point, the fact that they are losing money on an operating basis means that they must rely exclusively on their available cash to service their debt. Not only does that limit their financial flexibility, but the longer that condition continues, the greater the chance the company could experience liquidity problems down the road. For the time being, it’s just a warning flag, but it does bear watching.
Dividend: NXPI pays an annual dividend of $1 per share, which at its current price translates to a dividend yield of 1.05%.
Price/Book Ratio: there are a lot of ways to measure how much a stock should be worth; but one of the simplest methods that I like uses the stock’s Book Value, which for NXPI is $30.21 per share. At the stock’s current price, that translates to a Price/Book Ratio of 3.06. The company’s Book Value declined from $31.96 in the quarter prior. The historical average for NXPI is 2.7, which means that NXPI is about 12% overvalued at current price levels. The stock’s Price/Cash Flow ratio offers a contrasting perspective since it is currently trading more than 71% below its historical average; but for me, the wide disparity between these two measurements is also a negative, not a positive.
Technical Profile
Here’s a look at the stock’s latest technical chart.
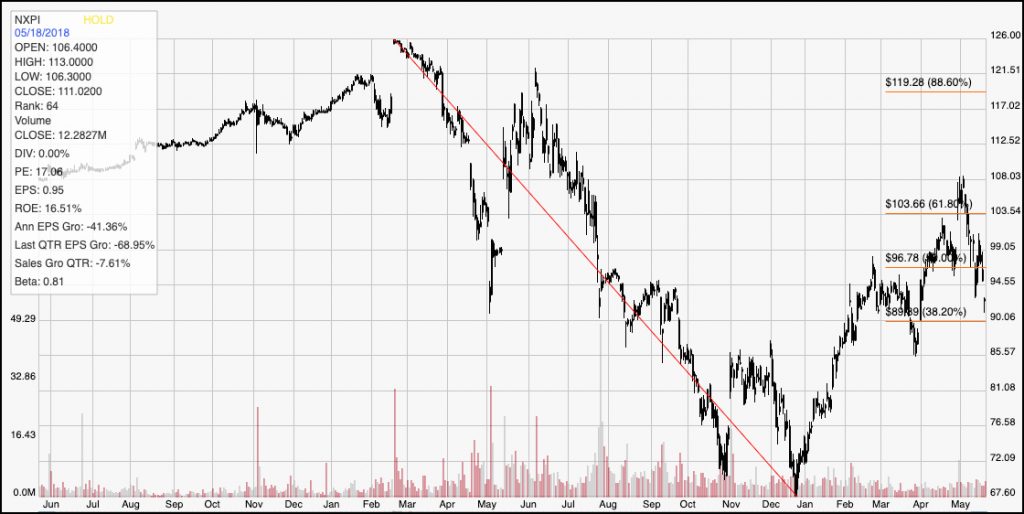
Current Price Action/Trends and Pivots: The chart above gives a good view of the stock’s activity over the past two years. The stock’s rally through the beginning of this month pushed the stock above the 61.8% Fibonacci retracement line, giving the stock a very strong intermediate-term upward trend; but the stock is currently just a few dollars above the 38.2% retracement line, showing how far its newly bearish momentum has forced the stock to drop and also putting it at risk to completely reverse that upward trend. A break below support from the 38.2% line at around $90 should see the stock quickly find its next support at around $85 based on previous pivots in that range earlier in the year as well as in November of last year, and a break below that point could see the stock free-fall from that point all the way back to its December, and multi-year low at around $68 per share.
Near-term Keys: There is really no basis for any kind of bullish short-term trade, but a break below $90 would be a strong signal to short the stock or buy put options with a near-term target at around $85 per share. The stock would need to break above $97 before any kind of near-term bullish signal could be seen. I don’t think the stock offers any kind of good value proposition right now; its fundamental profile isn’t horrible, but its current negative operating profile implies that the company is being adversely affected by trade concerns as well as broader issues for the semiconductor industry in general; as long as those concerns persist, it’s hard to make a strong long-term argument for buying the stock right now.