Sometimes it’s a good idea to take a forced break from the prevailing news of the day and turn your focus to other things. Ih the stock market right now, all anybody seems to want to talk about is the trade war and the latest chapter in an ongoing debate that doesn’t appear ready to find any resolution in the near-term. Accepting that fact, and the likelihood that it will mean stocks should continue to be volatile for the time being should actually make it easier to disconnect, at least temporarily from that commentary and pay attention to other parts of the market to find other useful opportunities.
Also seemingly lost in the noise of tariffs, Trump and China is the fact that the economy continues to be pretty healthy. I was interested the other day when Dr. Raphael Bostic, the President of the Atlanta Fed was interviewed on CNBC and asked about speculation that the Fed might do as the President has tweeted they should do, and actually lower interest rates to encourage economic growth. That is an action that central banks typically make when an economy is struggling, and so when the question was posed to Dr. Bostic, it really wasn’t all that surprising to me when he said quite pointedly that he could see no reason for such an action at any point during 2019. Translation? The economy is already healthy, and growing; it doesn’t need any additional stimulus. He also indicated that there was no real basis for increasing rates right now, either, putting him pretty squarely in line with the position Fed Chair Jerome Powell has held throughout the year.
A generally healthy economy usually means that employment is high, wages are increasing, and consumers have more disposable income to work with. All of those are elements that usually work in the favor of companies that operate in the Consumer Discretionary sector, which is why it is also no surprise that the sector is up a little over 17% this year, as measured by the S&P 500 Consumer Discretionary Sector SPDR ETF (XLY). That fact is one of the reasons that I decided to use Hyatt Hotels Corp (H) as the stock for today’s highlight. More disposable income usually means consumers have more opportunities, and reasons to go on trips and take vacations, which is usually a positive for stocks in the Hotels, Restaurants and Leisure industry. H has followed the Consumer Discretionary sector’s trend higher this year, to the tune of an increase of about 13.25% year-to-date; but while the sector has declined by about -3.5% in the last month, H has held up pretty well, sitting at practically the same level it was at four weeks ago. The stock is also still about 10% below its 52-week high price, at around $85 per share. Are the stock’s fundamentals strong enough to suggest it could still be an attractive value, with good reason to move even higher than $85? Let’s find out.
Fundamental and Value Profile
Hyatt Hotels Corporation is a global hospitality company. The Company develops, owns, operates, manages, franchises, licenses or provides services to a portfolio of properties. The Company operates through four segments: owned and leased hotels; Americas management and franchising (Americas); ASPAC management and franchising (ASPAC), and EAME/SW Asia management and franchising (EAME/SW Asia). The owned and leased hotels segment consists of its owned and leased full service and select service hotels. The Americas segment consists of its management and franchising of properties located in the United States, Latin America, Canada and the Caribbean. The ASPAC segment consists of its management and franchising of properties located in Southeast Asia, as well as China, Australia, South Korea, Japan and Micronesia. The EAME/SW Asia segment consists of its management and franchising of properties located in Europe, Africa, the Middle East, India, Central Asia and Nepal. H has a current market cap of $2.9 billion.
Earnings and Sales Growth: Over the last twelve months, earnings increased by more than 36%, while sales increased nearly 23%. In the last quarter earnings dropped more than -27% while sales increased about 9%. The company’s margin profile is showing signs of deterioration, as Net Income as a percentage of Revenues decreased from a healthy 9% over the last twelve months to just a little more than 5% in the most recent quarter.
Free Cash Flow: H has generally healthy free cash flow of about $387 million over the last twelve months. This number translates to a Free Cash Flow Yield of 4.84%, which is modest. It should be noted that in the first quarter of 2018, Free Cash Flow was more than $1.8 billion, indicating a significant decline over the last year and a half.
Debt to Equity: H has a Debt/Equity ratio of .56, which is relatively conservative. Their balance sheet indicates the company has about $625 million in cash and liquid assets against $2 billion in long-term debt. Their balance sheet indicates that servicing their debt shouldn’t be a problem for the time being; however the company’s current pattern of declining Net Income and Free Cash Flow is a concern that shouldn’t be discounted.
Dividend: H pays an annual dividend of $.76 per share, which at its current price translates to a dividend yield of 1%.
Price/Book Ratio: there are a lot of ways to measure how much a stock should be worth; but one of the simplest methods that I like uses the stock’s Book Value, which for H is $34.44 per share. At the stock’s current price, that translates to a Price/Book Ratio of 2.22. The company’s Book Value declined from $35.53 two quarters ago. The historical average for H is 1.9, which means that H is about -14.5% overvalued at current price levels. The stock’s Price/Cash Flow ratio offers a contrasting perspective, since it is currently trading more than 34% below its historical average; but for me, the wide disparity between these two measurements is also a negative, not a positive.
Technical Profile
Here’s a look at the stock’s latest technical chart.
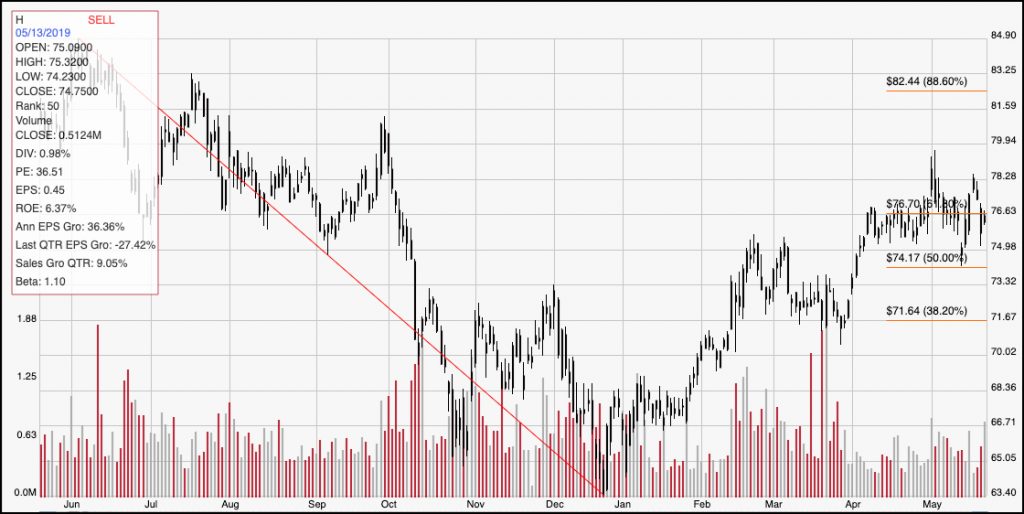
Current Price Action/Trends and Pivots: The chart above gives a good view of the stock’s activity over the year. The stock’s downward trend through the end of last year provides the basis for the Fibonacci retracement lines shown on the right side of the chart. The stock’s upward trend from that December low around $63.50 has pushed the stock to its 61.8% retracement line, which it has established a pretty clear consolidation pattern, with resistance around the $78 level and support around $75. A break above or below that range will likely determine the next significant move for the stock; a push above $78 would mark a continuation of the upward trend, while a break below $75 would signal the beginning of a new downward trend. Which signal will materialize is the question; the smart thing for now is to wait to see which break happens before you make any specific trading decisions on this stock.
Near-term Keys: The fundamentals for H are mostly good; but there are enough cracks in some metrics that I think are indicative not only of current strength, but also of the company’s ability to maintain that strength for the foreseeable future, that I think caution is warranted. That means that I believe the stock is overvalued right now; based on its Book Value relative to historical ratios, I think the stock’s bargain price is somewhere in the $52 range. There could be some interesting opportunities to work with short-term trades, however if you’re willing to wait and see which direction the stock moves to break out of its current consolidation pattern. A bullish break, above $78 could be a good signal to buy the stock or work with call option, with a short-term target at around $82 per share, while a drop below $75 could be used as an opportunity to short the stock or buy put options with an eye on the 38.2% retracement line, at about $71.50 as a near-term exit target.