Since the end of April, it hasn’t been all that unusual to see stocks -10% or more. Considering, however that even with its own pullback from a new all-time high in the last three weeks, the stock market remains more than 14% higher year to date, the normal expectation right now when you look at most stocks is to see them following a very similar pattern. Stocks that underperform and differ from the broad market’s pattern are called losers and generally dismissed by most analysts and investors; but the truth is that is also where some of the best long-term opportunities are to be found. That is also more likely to be true if the “loser” you’re looking at has a strong fundamental profile to counter its decline.
The Mosaic Company (MOS) is a company in the Materials sector with a solid fundamental profile, but as a fertilizer and animal feed producer, it operates in a highly cyclical industry. Since November, the stock is down a little over -40%, and -15% in just the last month, putting it clearly into that “loser” category I just mentioned. The extended health of the economy in general suggests that MOS’ cost of goods is higher than normal; whether that is a sign the company’s fortunes are about to reverse remains to be seen. Most analysts are forecasting healthy growth figures for the industry in general, and for MOS specifically through the rest of the year and into 2020, and is something that should act as a tailwind to help the stock turn around, but if current trade-related pressures continue, they could put even more pressure on the broader economy.
The stock’s decline over the last six months puts it in territory it hasn’t seen since late 2017. Does that make the stock a good value right now? The company has an interesting fundamental profile, and a value proposition that is becoming more and more compelling by the day right now. Let’s take a look at the numbers so you can decide if it is a stock you should pay closer attention to.
Fundamental and Value Profile
The Mosaic Company is a producer and marketer of concentrated phosphate and potash crop nutrients. The Company operates through three segments: Phosphates, Potash and International Distribution. The Company is a supplier of phosphate- and potash-based crop nutrients and animal feed ingredients. The Phosphates segment owns and operates mines and production facilities in Florida, which produce concentrated phosphate crop nutrients and phosphate-based animal feed ingredients, and processing plants in Louisiana, which produce concentrated phosphate crop nutrients. The Potash segment mines and processes potash in Canada and the United States, and sells potash in North America and internationally. The International Distribution segment markets phosphate-, potash- and nitrogen-based crop nutrients and animal feed ingredients, and provides other ancillary services to wholesalers, cooperatives, independent retailers and farmers in South America and the Asia-Pacific regions. MOS has a current market cap of about $8.6 billion.
Earnings and Sales Growth: Over the last twelve months, earnings increased 25%, while revenues declined by -1.76%. These numbers both declined in the last quarter; earnings dropped by -67.5%, and sales decreased almost -25%. The company’s margin profile shows that Net Income as a percentage of Revenues improved from 5.84% over the last twelve months to 6.88% in the last quarter.
Free Cash Flow: MOS’s free cash flow is modest, at $271 million; it also translates to a Free Cash Flow Yield of about 3.08%. This is significantly below the company’s Free Cash Flow peak, which was a little over $1 billion in the 3rd quarter of 2018.
Debt to Equity: MOS has a debt/equity ratio of .42. This is a conservative number. MOS currently has a little over $384 million in cash and liquid assets against about $4.5 billion in long-term debt. The company’s balance sheet indicates their operating profits are more than adequate to service the debt they have; but cash has also declined from about $1 billion in the 3rd quarter of 2018 to its current level, which does suggest that liquidity could become a concern.
Dividend: MOS’s annual divided is minimal, at only $.10 per share; that translates to a yield of just .44% at the stock’s current price.
Price/Book Ratio: there are a lot of ways to measure how much a stock should be worth; but one of the simplest methods that I like uses the stock’s Book Value, which for MOS is $28.01 and translates to a Price/Book ratio of .79 at the stock’s current price. Their historical average Price/Book ratio is 1.1, suggesting suggests the stock is currently trading at a discount of almost 38%. The stock’s Price/Cash Flow ratio provides an even more optimistic view, since the stock is currently sitting 52% below its historical average; together, both ratios provide a long-term target range between $31 and $34 per share. It is also noteworthy that MOS’ Book Value increased by $.50 per share in the last quarter.
Technical Profile
Here’s a look at the stock’s latest technical chart.
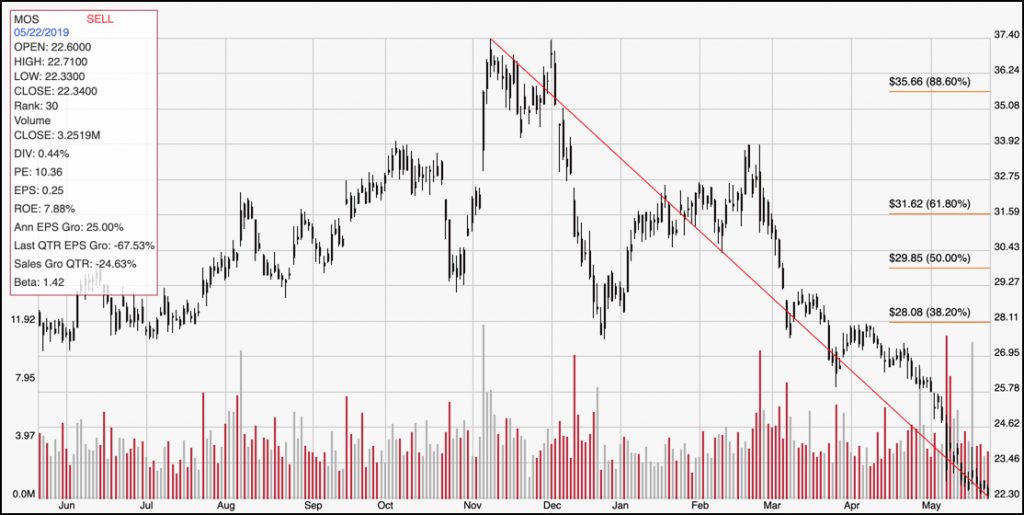
Current Price Action/Trends and Pivots: The red line on the chart above outlines the stock’s downward trend from November of last year to now; it also informs the Fibonacci retracement levels on the right side of the chart. The stock has significant bearish momentum right now, having broken through its most recent support level around $23. Its next closest support is around $20 from pivot levels last seen in the fourth quarter of 2017.
Near-term Keys: Trying to find a short-term bullish trade in this stock is pretty hard right now, and frankly would fall on the side of extreme, foolish speculation. Considering the size of the stock’s decline to its current levels, it’s also hard to suggest a short-term bearish trade of any kind, since the stock is already plumbing the lower extremes of its historical trading ranges; it’s a bit like trying to scrape the bottom of an empty barrel for water. The value proposition for the stock is attractive; but given the current bearish momentum in the stock, it would probably be smarter to wait before taking any kind of long-term position with this stock until it begins to show signs of stabilization around a new level of support.