It’s been a shaky couple of weeks leading up to Monday’s Memorial Day holiday. At the end of April, the market pushed to a new all-time high, and most experts were singing the praises of the economy and the market. Most reports seemed to indicate that a trade deal between the United States and China was closer than ever, and the market was eager to price in the anticipation of a compromise in that conflict. Then the Trump administration accused the Chinese of reneging on previously agreed conditions and went ahead and increased tariffs on Chinese imports from 10% to 25%. China retaliated with new tariffs of its own and level accusations of its own, especially after Chinese telecommunications giant Huawei was blacklisted by the administration and U.S. companies like Google, Intel, Qualcomm and other moved to cut ties for the time being.
Tariffs and the trade war have been right at the center of the market’s attention all month long, and so it should be no surprise to anyone that the market has struggled – or that it is likely to keep struggling as long as the two sides keep hurling accusations at each other. As measured by the S&P 500 SPDR ETF (SPY), the market is down almost 4% from its peak at the beginning of this month. That’a a decline following a major rally beginning in January that has a lot of investors wondering if tariffs will finally be “the thing” that puts a lid on U.S. economic growth.
The concern has weighed down on a lot of stocks, but especially those that are the most exposed to tariffs. Assuming they remain in place for the foreseeable future, it seems unlikely that these companies will be able to shield consumers from the increase in costs that will inevitably result. That is why stocks in sectors like Technology, Industrials, and Autos have been among the worst performers over the last month. That pressure has pushed stocks like Borgwarner Inc. (BWA) back down near to multi-year lows last seen in December of last year. Does that mean these kinds of stocks are a bad risk to be taking under current conditions?
I think the answer depends, up to a point, on the individual company. BWA is a company that supplies the entire automative sector. Trade tensions, which began in the first quarter of 2018, have been among the factors that pushed the stock from a high in early 2018 at around $58 to a December low just a little above $32. The market’s rally through April of this year gave the stock strong bullish momentum to rally as high as $44 before dropping back again this month. Since the end of April, the stock is down nearly -19%. That performance belies some important fundamental strengths that I think bode well for the company’s ability to weather current conditions on the trade front; which also means that at current prices, the stock really does look like an incredible value. Take a look for yourself.
Fundamental and Value Profile
BorgWarner Inc. is engaged in providing technology solutions for combustion, hybrid and electric vehicles. The Company’s segments include Engine and Drivetrain. The Engine segment’s products include turbochargers, timing devices and chains, emissions systems and thermal systems. The Engine segment develops and manufactures products for gasoline and diesel engines, and alternative powertrains. The Drivetrain segment’s products include transmission components and systems, all-wheel drive (AWD) torque transfer systems and rotating electrical devices. The Company’s products are manufactured and sold across the world, primarily to original equipment manufacturers (OEMs) of light vehicles (passenger cars, sport-utility vehicles (SUVs), vans and light trucks). The Company’s products are also sold to other OEMs of commercial vehicles (medium-duty trucks, heavy-duty trucks and buses) and off-highway vehicles (agricultural and construction machinery and marine applications. BWA has a current market cap of about $7 billion.
Earnings and Sales Growth: Over the last twelve months, earnings decreased a little over -9%, while revenues dropped almost -8%. In the last quarter, earnings dropped about -17%, while sales were mostly flat. The company’s margin profile shows that Net Income as a percentage of Revenues over the last twelve months were about 8.4%, but weakened in the last quarter to 6.23%. If you take each Net Income figure by itself, these aren’t terrible numbers; but the negative pattern is reflective of the effect of trade on the auto industry in general, and is a reason that there could continue to be quite of negative pressure on auto stocks in general.
Free Cash Flow: BWA’s free cash flow is healthy and improving, at $629.5 million. This number also improved since the last quarter of 2018, when it was about $552 million, and since the last quarter of 2015, when it dropped below $150 million. This also translates to a useful Free Cash Flow Yield of 8.6%.
Debt to Equity: A has a debt/equity ratio of .44. This is a very manageable number, that suggests the company should have no trouble servicing their debt. Their balance sheet shows $517 million in cash and liquid assets against about $1.9 billion in long-term debt. Both of these numbers have also improved since the end of 2018, which is a useful counter to the negative pattern in earnings growth and the modest drop in Net Income.
Dividend: BWA’s annual divided is $.68 per share and translates to a yield of 1.92% at the stock’s current price.
Price/Book Ratio: there are a lot of ways to measure how much a stock should be worth; but one of the simplest methods that I like uses the stock’s Book Value, which for BWA is $21.16 and translates to a Price/Book ratio of 1.67 at the stock’s current price. Their historical average Price/Book ratio is 2.56, suggesting the stock is currently trading at a major discount of almost 35%. That is supported by the stock’s Price/Cash Flow ratio, which is currently about 51% below its average. Together, these provide a very compelling reason to take this stock seriously, with a long-term price of between $54 and $73 per share. That means the stock has some very good fundamental reasons to drive back near to the 52-week highs it saw in 2018.
Technical Profile
Here’s a look at the stock’s latest technical chart.
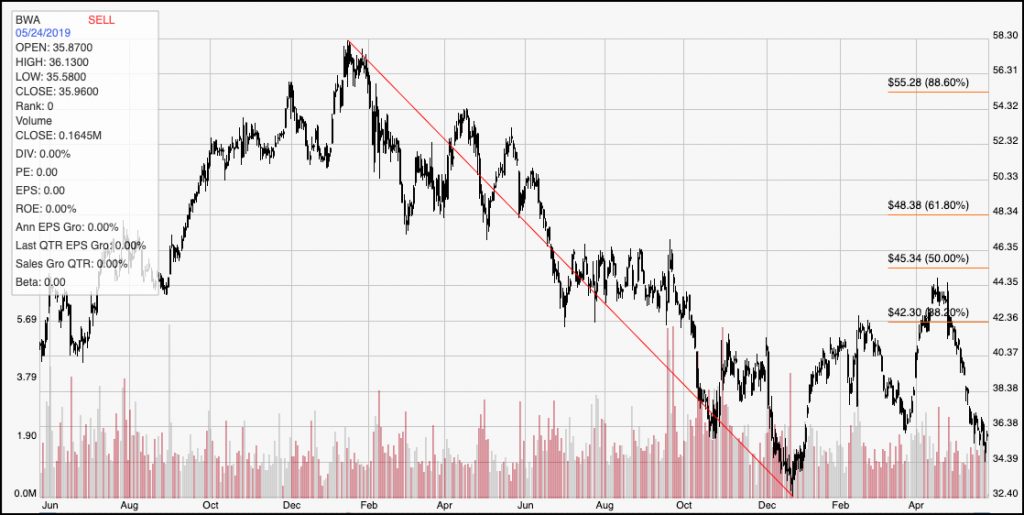
Current Price Action/Trends and Pivots: The red diagonal line measures the length of the stock’s longer-term downward trend, and also informs the Fibonacci trend retracement lines shown on the right side of the chart. The stock’s downward trend through 2018 is easy to see; but so is the the stock’s rally from a low point around $33 per share to its high at around $44. That rally has pushed the stock above the 38.2% Fibonacci retracement line, but from that point bearish momentum really picked up quickly, with the stock dropping back sharply to its current level around $36 per share. The stock could be picking up a bit of support around $35 if the movement of the last two days is to be believed; but the stock is also just a few dollars away from its multi-year low near $32. Any kind of bullish reversal of the stock’s current short-term, bearish pattern can’t be verified until the stock breaks above $36 at least; but even that would be a very aggressive bullish signal point. To reconfirm the stock’s bullish momentum from the first five months of the year, the stock would need to push above its last peak at $44.
Near-term Keys: If you’re a short-term trader, there is no bullish trade that offers a reasonable probability of success right now; trying to work with put options or short the stock right now also only offers a very limited of profit potential, so justifying a bearish trade under these conditions is also difficult to do. On the other hand, if you like the stock’s bargain proposition and fundamental profile, there is an excellent case to be made for the stock as a good value position. If the stock’s current bearish momentum makes you wary, that’s fine; wait for the stock to shows signs of stabilization around its next support level, and then start looking for ways to position yourself for what I think is a good long-term opportunity, even under current market conditions.