It’s interesting to see the different reactions people have to news. Not surprisingly, a lot of it has to do with the kind of news we pay attention to. If you pay more attention to politics, then you’re likely to be most passionate about current political events and issues. If you’re an active investor, then economic news has a way of pushing its way to the center of your focus. For me, even political or regional news gets cast against the backdrop of the current state of the national and global economy.
Over the last few weeks as trade tensions between the U.S. and China have increased, it’s been interesting to measure how well informed people are about the issue. I’ve talked to a few neighbors, and even my own wife, and been a little surprised to find out that while they were aware of the trade conflict and that tariffs were a reality between both countries, they hadn’t really even begun to think about what the effect of those tariffs were likely to be the longer they continue. Some of those neighbors include successful people in a variety of industries and areas of business. They were surprised when I pointed out a few simple examples that could already be seen if you took a moment to notice.
As investors, the same thing can happen if you don’t factor current events into your analysis properly. I’m not saying that news should be a central part of an investing system; but it must absolutely be a part of a system that is built for long-term success, because understanding how current events factor into a company’s current and future business prospects can help you make better decisions about opportunity and risks in the investments you consider.
Micron Technology (MU) is a stock in the Technology sector that I’ve been following for some time, and I’ve even written about it in this space before as one of the biggest bargains in the market. That seemed to be especially true at the beginning of this year as the stock had dropped to a multi-year low point at around $28 before Christmas. The stock also rallied nicely until the beginning of May, hitting a short-term peak at around $42 per share before trade pressures reasserted themselves on the broad market and on the tech sector in particular. As tensions have only seemed to ratchet higher in recent weeks, MU is an example of a stock that I think is right on the jagged edge of the risk: reward argument.
The risk I’m talking about might be easy to overlook if you only pay attention to the stock’s fundamental metrics, or the compelling value proposition that the stock carries right now. By themselves, they are such that you would normally see me write about the fact that the stock’s decline in the last month to just a few dollars above that late December 2018 low point is just creating a terrific new opportunity. The problem comes from the fact that perspective overlooks broader market and trade risk right now. From a broad market sense, it is seems clear that supply of memory products – DRAM and NAND, in particular, which is where MU specializes – will exceed demand through the rest of this year and into 2020. More alarming is the trade risk exposure: MU’s single biggest customer is Huawei Technologies, the Chinese tech giant that has been blacklisted by the U.S. government, and that forces U.S. companies like MU to halt the sale of any of their products for new Huawei development. Those two factors alone seem to be the biggest reason that I’m seeing analysts pointing to a sales decline of 22% or more through the end of 2019 for this stock. The longer tariffs continue without a resolution, the harder it is that MU will likely be hit – something that could erode a currently incredibly impressive balance sheet to the point to render any conversation about value moot.
Fundamental and Value Profile
Micron Technology, Inc. (MU) is engaged in semiconductor systems. The Company’s portfolio of memory technologies, including dynamic random-access memory (DRAM), negative-AND (NAND) Flash and NOR Flash are the basis for solid-state drives, modules, multi-chip packages and other system solutions. Its business segments include Compute and Networking Business Unit (CNBU), which includes memory products sold into compute, networking, graphics and cloud server markets; Mobile Business Unit (MBU), which includes memory products sold into smartphone, tablet and other mobile-device markets; Storage Business Unit (SBU), which includes memory products sold into enterprise, client, cloud and removable storage markets, and SBU also includes products sold to Intel through its Intel/Micron Flash Technology (IMFT) joint venture, and Embedded Business Unit (EBU), which includes memory products sold into automotive, industrial, connected home and consumer electronics markets. MU’s current market cap is $37.6 billion.
Earnings and Sales Growth: Over the last twelve months, earnings declined by -40%, while revenues dropped by a -20.5%. In the last quarter, earnings declined by -43, and sales by -26%. The company’s operating profile is impressive, and taken by themselves would imply strength; however, there is a negative pattern in place that should be considered as well. Over the last twelve months, Net Income was 43.5% of Revenues, and narrowed to 27.7% in the last quarter. It is true these numbers are still strong, but they don’t reflect the impact of increased tariffs, or of the restriction of sales to the company’s single largest customer as of yet. That effect remains to be seen.
Free Cash Flow: MU’s free cash flow is very healthy, at more than $7.65 billion. That translates to an outsized Free Cash Flow Yield of 20.3%.
Debt to Equity: MU has a debt/equity ratio of .10. This number reflects the company’s manageable debt levels, and has dropped over the last year from .2. This is also an indication of strength, and could signal that despite the risks I’ve already outlined, the company should be well-positioned to ride out current turbulence, even if it persists for the long-term. The company’s balance sheet indicates cash and liquid assets are a little over $7.5 billion (an increase over about $5 billion at the end of 2018) versus debt of about $3.6 billion (slightly lower over the same period, from about $3.7 billion).
Dividend: MU does not pay an annual dividend, which is the norm for most tech stocks.
Price/Book Ratio: there are a lot of ways to measure how much a stock should be worth; but one of the simplest methods that I like uses the stock’s Book Value, which for MU is $32.01 per share, and has increased from $25.45 per share a year ago. That number also translates to a Price/Book ratio of 1.06 at the stock’s current price. Their historical average Price/Book ratio is 2.02. That suggests the stock is trading right now at a discount of more than 90%, and that puts the stock’s long-term target above $64 per share. The stock’s Price/Cash Flow is also significantly below its historical average, by more than 50%; that puts a long-term target price for the stock at around $85 per share. I think that both of those numbers are probably not realistic within even the next two years given the current state of trade concerns; but that could change quickly if and when the U.S. and China finally manage to find a resolution.
Technical Profile
Here’s a look at the stock’s latest technical chart.
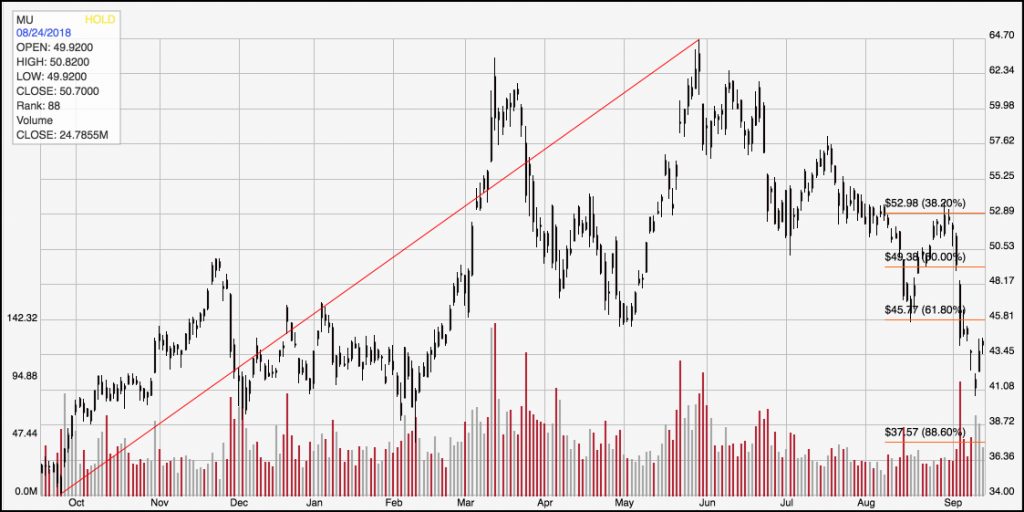
Current Price Action/Trends and Pivots: The red diagonal line measures the length of the stock’s downward trend since last May of last year to its trend low in December; it also informs the Fibonacci trend retracement lines shown on the right side of the chart. The stock used the trend low in late December as a launching point for a new, short-term upward trend that saw the stock rally a little above the 38.2% retracement line at around $42 per share before bearish sentiment returned to the tech sector. The stock is having a hard time right now finding any kind of bullish to use as a consolidation point, and is about $5 per share above that December 2018 low point. Working off previous pivots does show that the stock could be at a good level of support right now, having used the $33.50 to $34 level as a pivot low point on three separate occasions since late October; but whether that level holds now remains to be seen. If it doesn’t, expect the stock to retest its low around $28 per share. In order to signal any kind of useful bullish momentum, the stock would need to break above $36 per share, to $37 at minimum, while a re-confirmation of the stock’s upward trend from the beginning of the year won’t be seen unless the stock can push back above $42.30 to reach at least the $43 to $44 level.
Near-term Keys: It’s frustrating to look at a stock that offers such an impressive value proposition and realize that factors largely outside the company’s control could act to erode that value opportunity in the weeks and months ahead, but there are points where even the most determined value-oriented investor would be foolish to discount current market conditions. The risk that the stock could not only test its 52-week low, but push even lower if the trade picture continues to darken simply overrides any kind of bullish forecast right now. The only kind of short-term trade that I think makes any sense right would be to use a drop below $33 as a signal to short the stock or start working with put options, using the $28.50 to $28 level as a good exit point for the trade.