One of the biggest challenges for most investors, no matter what your preferred investing strategy actually is, is being able to see past all of the latest news and market buzz to identify where the real opportunities lie. Politics, current events and “the next big thing” often tend to get in the way, prompting average investors to pay attention to the same things everybody else is.
Current news right now really seems to focus on just one thing right now. Tariffs, trade, China, and now Mexico – no matter what else is going on, the conversation just seems to rotate back to the latest sound bite coming out of the White House. Exposure to trade risk means that most investors right now are going to shy away from industries like technology and industrials, where tariffs have already started to reflect on corporate results.
The truth is that while risk does impact industries on a broad basis, there are always individualized exceptions to the rule. As it relates to trade risk, companies that are the most exposed to this risk are multinational corporations whose revenue and business operations are derived from China or Mexico. If you can find a stock whose business operations are more focused domestically, that trade risk may not be completely mitigated, but it generally is greatly minimized.
Xerox Corp (XRX) is a name that practically every American should be familiar with, but that tends to get overshadowed by most of the biggest current names in the Technology sector. But while most of those stocks, and the sector in general, has been struggling over the past month as trade tensions have increased (as measured by XLK, the S&P 500 Information Technology Sector SPDR ETF, the sector is down about -3.5%), XRX is actually up a little over 2% for the month, and nearly 6% in the last week. More impressively, the stock is up a little over 69% since the beginning of the year.
For a value investor, that impressive performance usually prompts a value-oriented investor to pass the stock by and move on to something else. In the case of XRX, however, there are some compelling fundamental metrics that indicate not only that the company is seeing positive traction in its current business strategies, but also that the stock could still be poised for ongoing, impressive price performance in the long-term. Is this a stock you should be paying attention to? Let’s run the numbers.
Fundamental and Value Profile
Xerox Corporation is a provider of digital print technology and related solutions. The Company has capabilities in imaging and printing, data analytics, and the development of secure and automated solutions to help customers improve productivity. The Company’s primary offerings span three main areas: Managed Document Services, Workplace Solutions and Graphic Communications. Its Managed Document Services offerings help customers, ranging from small businesses to global enterprises, optimize their printing and related document workflow and business processes. Managed Document Services includes the document outsourcing business, as well as a set of communication and marketing solutions. The Company’s Workplace Solutions and Graphic Communications products and solutions support the work processes of its customers by providing them with printing and communications infrastructure. XRX’s current market cap is about $7.5 billion.
Earnings and Sales Growth: Over the last twelve months, earnings increased almost 34%, while sales decreased by about -9.5%. In the last quarter, earnings decreased about -20% while revenues dropped almost -13%. XRX operates with a relatively narrow, but improving margin profile; Net Income versus Revenues over the past year was 4.9%, but increased in the last quarter to 6.02%.
Free Cash Flow: XRX’s free cash flow is healthy, at a little more than $1.03 billion. That translates to an attractive Free Cash Flow Yield of 13.7%. It is also worth noting that XRX’s Free Cash Flow was $0 one year ago.
Debt to Equity: XRX has a debt/equity ratio of .84. That’s generally a conservative number that reflects management’s approach to debt management. Since the beginning of 2018, the company’s long-term debt has decreased from a little more than $5.2 billion to its current level of $4.2 billion. Their balance sheet also shows $723 million in cash and liquid assets.
Dividend: XRX pays a dividend of $1.00 per share, which translates to an annual yield of 2.99% at the stock’s current price.
Price/Book Ratio: there are a lot of ways to measure how much a stock should be worth; but one of the simplest methods that I like uses the stock’s Book Value, which for XRX is $22.31, and which translates to a Price/Book ratio of 1.49 at the stock’s current price. The stock’s historical average Price/Book ratio is 2.25, which means the stock is undervalued by a little more than 50%. That is supported by a Price/Cash Flow ratio that is about 41% below its historical average. Together, these metrics put the stock’s long-term target price between $47 and $50 per share.
Technical Profile
Here’s a look at the stock’s latest technical chart.
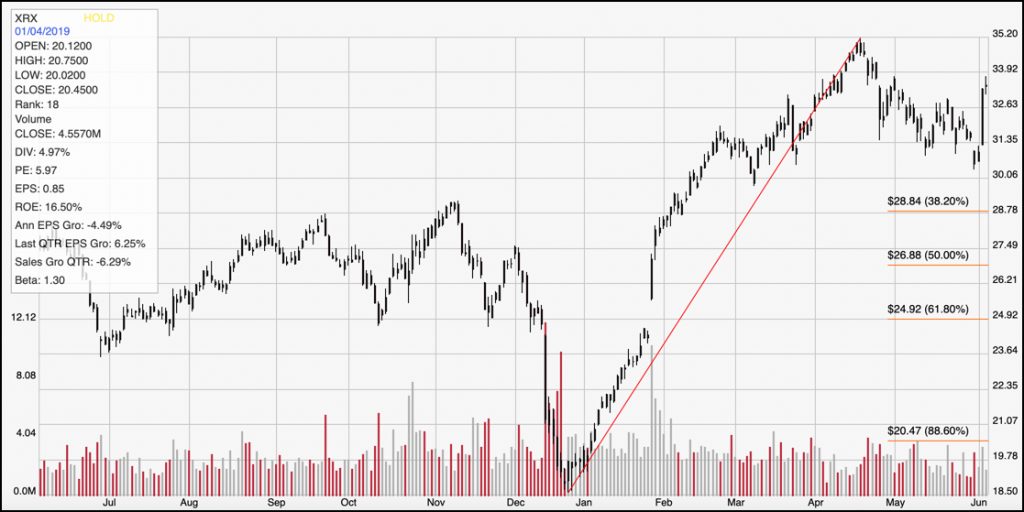
Current Price Action/Trends and Pivots: The diagonal red line traces the stock’s upward trend through the first four months of this year, from a low point at about $18.50 to its mid-April high at around $35 per share. It also provides the range to calculate the Fibonacci retracement lines shown on the right side of the chart. The stock pulled back to about the $30 level until a couple of days ago, and has picked up major bullish momentum in the last couple of days. It is now just a couple of dollars per share away from that April high. The current bounce off of pivot support looks like it could provide strong bullish momentum for the near term, but the stock would need to set a new 52-week high above $35.20 to reconfirm the upward trend from the beginning of the year. If the bullish momentum fades – and let’s face it, if trade winds blow back against the market yet again, that is a distinct possibility – a break below $31 could be taken as a confirmation of a bearish trend reversal, with room to see the stock test the 38.2% Fibonacci retracement line, or to drop even below that support level.
Near-term Keys: XRX is a stock with a solid fundamental profile, and a very interesting value proposition that belies the stock’s strong movement so far this year. That could make the stock a useful long-term value position – assuming you are willing to accept that the stock could see near-term downside into the mid-$20 range pretty easily if broader market pressures spill over into it. If you are an aggressive, short-term trader, there could be an interesting bullish opportunity to work with the stock right now, but there is limited immediate upside since the stock’s 52-week is less than two dollars away. A better signal to buy the stock or work with call options would come from a break above $35.20 to a new high. If you prefer to work the bearish side, a drop below $31 could be an excellent signal to short the stock or consider working with put options, with an eye on the stock’s next pivot low, and 38.2% retracement line between $28.50 and $28.75 as a very near-term target price.