When the only subject that anybody in the market wants to talk about at any given time is the latest addition to the trade narrative, it gets pretty easy to miss out on other important information that the market can give you. It’s part of a phenomenon that I like to call “missing the forest for the trees” – losing sight of what is really important because there are so many other things getting in the way.
I think the market is flashing a signal right now that I don’t see anybody talking about – and in the context of the market’s long-term upward trend that now stretches back more than a decade, it’s something that I think more and more people just might look back on a year from now and wonder, “Why didn’t I see that before?” The simple answer is that there is too much noise about anything and everything else right now. All analysts wants to talk about is the latest Trump tweet or sound bite, and to keep looking for reasons to say the market should be able to keep going higher. They’re afraid of the implications the trade war could have on the broad economy if it continues even longer than it has; but they want to try to gloss over the fact that corporate earnings are already starting to reflect the effect of tariffs on a global scale.
The market started off this week strongly, rebounding after President Trump announced a deal with Mexico to prevent the imposition of the 5% tariffs he had threatened last week. Seeing the market push to a sixth consecutive big move upward seems a little ironic to me, since all it really means is that investors and analysts can now go back to the much bigger question on the trade front, which remains whether the U.S. will be able to find a compromise with its single biggest trading partner. That isn’t to say Mexico isn’t significant as a trading partner – it is. But does being able to say that affairs with Mexico can return to the status quo increase the likelihood a much more important agreement can be made to ease escalating tensions with China? I’m less than convinced.
The point of my commentary today isn’t to argue the validity or fallacy of the Trump administration’s tariff policy, and it isn’t to try to predict what the outcome of that policy will be. It is to try to use that information, along with other information that I have seen market media outlets using to try to talk about all the reasons the market could keep going up as a backdrop that I think makes the signal I’m going to show you all the more important.
What other data? I was interested last week when Fed chairman Jerome Powell went on record saying that the Fed was prepared to do whatever was necessary to keep the longest period of economic expansion on record going. That is another element that the market used to say that if trade tensions persisted, the Fed might be impelled to cut rates in an attempt to counter negative effects from tariffs. That added fuel to the market’s short-term rally that as of Monday’s close saw the S&P 500 rally almost 6% higher, and back off of a very short-term low that actually threatened to push the market back into legitimate correction territory.
Before I show you the signal I’m so worried about, here are a couple of realities that I think average investors should be aware of as they listen to current market opinions and commentary around trade and interest rates. First, the longer trade tensions with China continue – and there has been no indication that China is backing down from its own respective stance – the more you should expect it to reflect negatively on the profitability of U.S. companies, especially those with multinational operations. As one former CEO I noticed commented on Monday, it’s natural that tariffs are negative for the economy at large. It is also clear, I believe, that the Trump administration sees them as a useful negotiating tool, or if you prefer to be more alarmist, even as a trade weapon. That is simply a reflection, in my opinion of something that I have long believed: when it comes to negotiating business, Donald Trump is willing to be more uncomfortable, for a longer period of time, than most of the people he negotiates against. It’s very much like a game of chicken where two cars hurtle down the road at each other at dangerous speeds – who can hold out the longest before somebody has to blink and swerve out of the way? Trump is absolutely betting that China will swerve first, and what the market thinks about what he’s doing is of secondary relevance at best.
The second reality is to consider the Fed’s approach to monetary policy, and its historical effect on the ebb and flow of economic growth, in realistic terms. The Federal Reserve’s mostly accommodative approach to interest rates stretches back much further than just the last ten years – the term “quantitative easing” came into vogue in the mid-2000’s as then-Chairman Alan Greenspan tried to help the market’s recovery from the “dot-com bust” gain momentum. Even with the lending crisis that prompted the market’s sell of and broad economic downturn in late 2007 and into 2008, the Fed’s attitude was to begin lowering rates as early as possible.
The market seem to be pinning at least some of its hopes of continued growth on the Fed’s ability to to keep interest rates to keep things going. The truth of the matter is that while interest rate policy can shorten the length of an economic downturn and possibly even temper the scope of a bearish long-term down trend in the stock market, it has historically failed miserably to actually prevent them. It’s also true that current interest rate levels remain significantly below historical norms, which means that if the economy does turn bearish, they may have limited ability to spur growth by following a consistent policy of lowering them even more.
With that information in mind, let’s take a look at the pattern I used as today’s headline. Here it is.
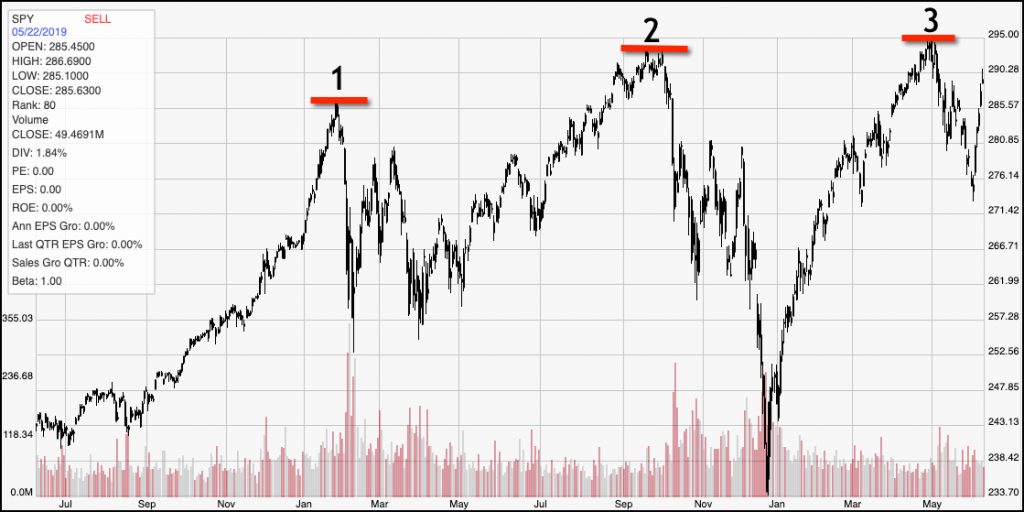
This is a one year-chart of the S&P 500 SPDR (SPY), the ETF that tracks the movement of the S&P 500. I’ve highlighted the last three major tops that have previously spurred the market to drawdowns that were strong enough to start casting the market’s continued strength into question. They occurred over a period of roughly 18 months. Technical traders like to call the emergence of three consecutive high-water marks at nearly the same level a “Triple Top Formation,” and it’s usually something that at the end of an extended, long-term upward trend is taken as a strong indication of a looming bearish trend reversal.
Some might point to the fact that it took the market a year and a half to see these three tops show themselves, and also to emphasize the reality that they actually each occur at slightly higher levels than the last one. Those aren’t actually bullish indications; in fact, they are just the reverse. Here’s why.
The simple fact is that a legitimate Triple Top Formation is one that normally takes months to emerge; that is one of the reasons not only that it is so important, but also why most investors miss it completely. The tendency to rely only on the latest, most recent information leads too many people to discount historical price action too quickly. This is a formation that has shown a high level of historical reliability in predicting the end of a long-term upward trend. The fact that the highs are occurring at gradually increasing levels is actually another long-term sign of slowing bullish momentum, which is also a leading bearish indication. To see what I mean visually, we need to take a longer look. Here it is.
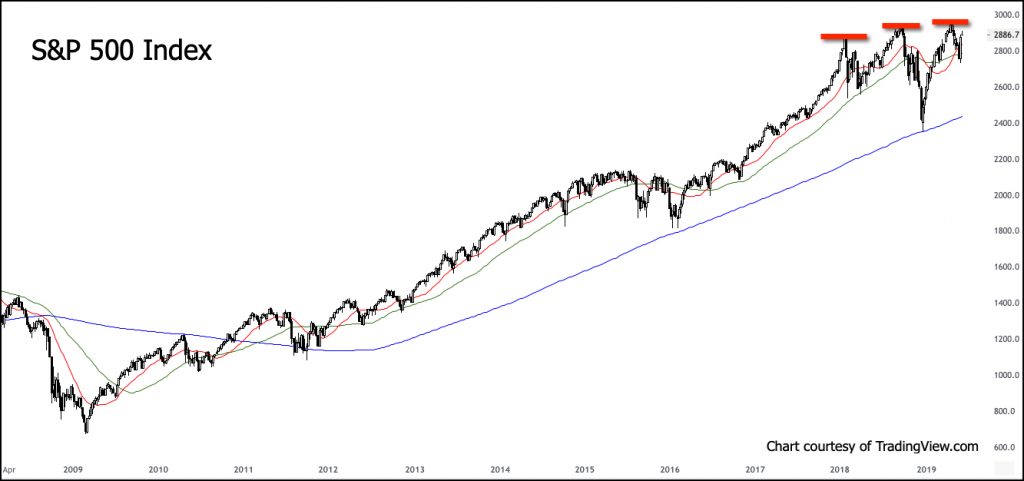
This chart covers the market’s upward trend dating back to early 2009, along with the latter stages of the bear market that ended at that time. The red, green and blue lines are visual indications of the market’s short, intermediate, and long-term trends, respectively. I highlighted the market’s current Tripe Top Formation at the far right of the chart for proper perspective. Notice that for the last ten years – with the single exception of the latter part of 2015 – the market’s pattern of higher highs along the upward trend has covered relatively short periods of time from one peak to the next. Even the pause in that pattern in 2015 was relatively short-term, finding a bottom in early 2016 to resume its strongly bullish pattern for the next two years. From early 2017 to now, however, those three peaks are an indication of slowing bullish momentum, and form a clear plateau at the top of a ten-year upward trend.
Is this a guaranteed bearish signal? Of course not; no technical pattern guarantees a particular type of market reaction will follow it. It should, however be taken as a clear indication that now, perhaps more than at any other point in the last year and a half, the market is reaching a critical turning point. If the market can push the S&P 500 to a new all-time high, with strong bullish momentum behind it, it’s not unreasonable at that point to go ahead and call for a resumption of the market’s long-term upward trend, with plenty of upside to go. Until then, the market’s three tops should be viewed as important levels of resistance that could keep short-term upside muted. Caution remains warranted for the time being.