Being a contrarian investor can mean a few different things. One is that while most investors shy away from stocks that are trading at historically low levels, a contrarian will usually immediately see an opportunity to look for a terrific bargain. Another is that the simple fact that a stock is going up often means that the contrarian’s first reaction will usually be to wonder how soon the stock is going to reverse and go back down.
Contrarian investing is often correlated with value investing, and I think that makes sense in a lot of ways; but one of the other things that being a contrarian prompts one to do is to gravitate to pockets of the market that aren’t following the direction of the broad market. For example, since late April, trade tensions and pressures have mostly put a lid on the market, even with the early last week and the first part of this week that reclaimed much of the broad decline we endured through all of May. One interesting example of a stock that has bucked the broader market’s trend over the last six weeks is J.M. Smucker Company (SJM). It increased over the first half of May, and although it did drop from that point, the stock is only down about -2.3% over the last month.
It is also a stock that has seen an impressive level of performance year-to-date, following the trend of the Consumer Staples sector, which has been among the market leaders in 2019. Year to date the stock is up about 32.5%. The contrarian in me is intrigued by the stock’s resilience over the past six weeks in the face of broader market pressures, but it also has to wonder in the same breath, how much opportunity is left? Like a lot of established names in the Food industry, SJM is a stock that is being forced to find ways to innovate and reshape its business to meet shifting consumer trends and preferences. It also has to do that with a business that, like most in the industry, survives on very narrow profit margins. The market so far has seemed to betting on the SJM’s side about the company’s ability to do that, but if you’re thinking about using the stock for a new, bullish position, you have to wonder if there is enough upside left to make the investment worthwhile. Let’s dive into the numbers to decide for ourselves.
Fundamental and Value Profile
The J. M. Smucker Company is a manufacturer and marketer of branded food and beverage products and pet food and pet snacks in North America. The Company’s segments include U.S. Retail Coffee, U.S. Retail Consumer Foods, U.S. Retail Pet Foods, and International and Foodservice. The Company’s U.S. retail market segments consist of the sale of branded food products to consumers through retail outlets in North America. In the U.S. retail market segments, the Company’s products are sold to food retailers, food wholesalers, drug stores, club stores, mass merchandisers, discount and dollar stores, military commissaries, natural foods stores and distributors, and pet specialty stores. In International and Foodservice, the Company’s products are distributed domestically and in foreign countries through retail channels and foodservice distributors and operators, such as restaurants, lodging, schools and universities, healthcare operators.SJM’s current market cap is $14.1 billion.
Earnings and Sales Growth: Over the last twelve months, earnings increased almost 8%, with sales growth increasing a little less than 7%. In the last quarter, earnings decreased almost -8%, with sales also declining about -5.5%. That points to increasing costs, which right now are coming from from foodstuffs as well as transportation costs. This reality is also reflected in SJM’s margin profile; over the last twelve months, Net Income was 6.56% of Revenues, but narrowed in the last quarter to about 3.75%. These are margins that have narrowed more than 50% over the last year, which is another sign that the company is operating less efficiently than it was a year ago.
Free Cash Flow: SJM’s free cash flow is adequate, at a little over $782 million for the trailing twelve month period; that translates to a Free Cash Flow yield of about 5.58%.
Debt to Equity: SJM has a debt/equity ratio of ..59, a relatively low number that indicates the company operates with a generally conservative philosophy about leverage. This number has decreased over the last two quarters from .73 as the company suspended stock buybacks and dividend increases to concentrate on debt paydown. A big portion of their long-term debt, which was about $4.6 billion in the last quarter comes from the acquisition of pet food company Ainsworth in May of 2018 for $1.7 billion. The also carry a limited amount of cash, at only about $206.5 million. While their balance sheet for now indicates their operating margin is adequate to service their debt, the fact is that liquidity is a concern and could be a challenge in quarters to come.
Dividend: SJM pays an annual dividend of $3.40 per share, which translates to a yield of 2.74% at the stock’s current price.
Price/Book Ratio: there are a lot of ways to measure how much a stock should be worth; but one of the simplest methods that I like uses the stock’s Book Value, which for SJM is $70.07 per share and translates to a Price/Book ratio of 1.76 at the stock’s current price. Their historical Price/Book average is 1.88, which suggests that the stock is only about 6.35% below that average – which hardly represents even an interesting value. Their Price/Cash Flow ratio offers a more optimistic perspective, since it is currently running about 23% below its historical averages. That ratio puts a long-term target price at about $152 per share.
Technical Profile
Here’s a look at the stock’s latest technical chart.
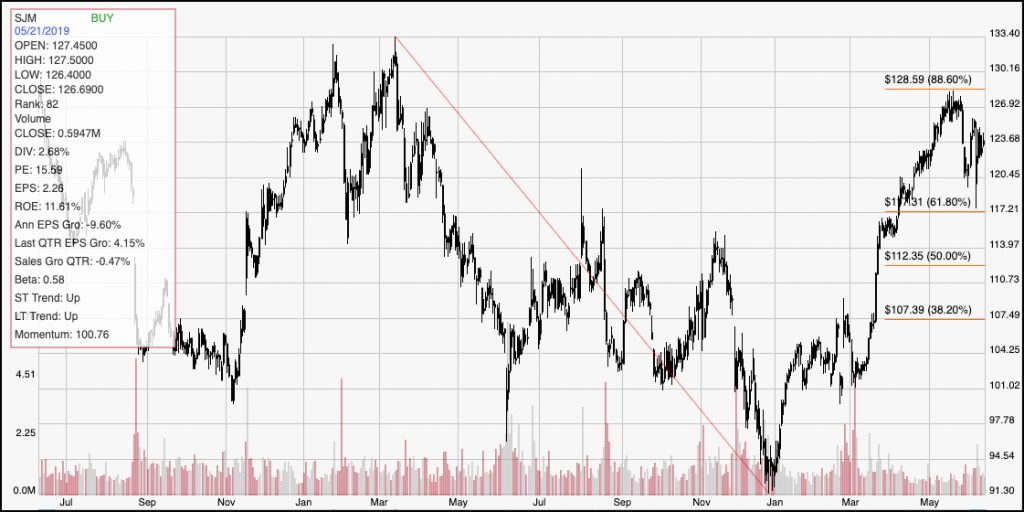
Current Price Action/Trends and Pivots: The chart above traces the stock’s downward trend from late April of 2017, where it peaked at around $144 per share, to its trend low point in December at about $91. It also informs the Fibonacci retracement lines shown on the right-hand side of the chart. The stock’s upward trend from that point is impressive, and the stock now sitting just about $5 per share below the 88.6% retracement line. That level acted as strong resistance in May, providing the basis for the pivot high that saw the stock drop to about $120.50 at the end of the month before rebounding a bit to its current level. There is strong support in the $120 range, with additional expected support if the stock drops below that level at the 61.8% retracement line at around $117 per share. If the stock can push up to $129, it would break the resistance at around $128.50 that the 88.6% retracement line is setting and could give the stock room to test its multi-year highs around $133 per share.
Near-term Keys: SJM is current sitting at a bit of a crossroads, where there isn’t a good signal currently for either a strong bullish or bearish trade. The stock’s upward trend should make a short-term trader lean bullish right now, but the smart move would be to wait to see if the stock can break above the current resistance in the $127 to $128.50 range before trying to buy the stock or work with call options. If the stock does pick up a new set of bearish momentum, however a drop below $120 could set up an interesting opportunity to short the stock or to work with put options, with an immediate target price at around $117 per share, and a secondary target at around $114. The stock’s deteriorating Net Income is a fundamental concern, as well as its liquidity, and so from a value perspective I’m more inclined to believe the valuation offered by the Price/Book ratio than I am the Price/Cash Flow ratio. That means that I would really need to see the drop to around the $100 to $105 level before I would start to take it seriously as any kind of legitimate value opportunity.