One of the things that has helped the market perform very well this year, along with the expectation that a trade deal between the u.S. and China will eventually get worked out, is the fact that most economic data measurements in the U.S. have continued to come in pretty healthy. Even the fact that tariffs from the trade war are starting to show their effects on the earnings of multinational U.S. companies haven’t seemed to dim investor’s enthusiasm for the market this year, and I think the strength of the economy, and the determination of the Fed to remain as patient and accommodative as possible.
The market’s strong performance has rippled across a lot of different sectors of the market, including Real Estate As measured by the S&P 500 Real Estate Sector SPDR ETF (XLRE), this is a sector that is up more than 20% since the beginning of the year. Companies in this sector can work a little differently than stocks in other sectors. Weyerhauser Company (WY) is an interesting example. If you’ve had to buy lumber for a home improvement project, you’ve probably acquired it from their Wood Products segment, which emphasizes the production and distribution of wood products. This is a company, however whose primary focus is on the timberlands and forest acreage that makes all of its segments possible. That puts the company in the category of a Real Estate Investment Trust (REIT), a segment of the sector that tends to see more attention from the market, especially from income seekers when interest rates from more traditional instruments like Treasury bonds and regular stock dividends remain low.
REIT’s are interesting because stocks in this segment tend to pay higher annual dividends than stocks in other industries, and WY is no different; at their current price, the stock’s dividend is impressive, at more than 5% per year. Of course, dividend yield alone shouldn’t be the only basis for any investment decision, especially if your plan is to hold onto the stock for any extended length of time. That means that diving in to the stock’s fundamental profile becomes very important. Another element that makes WY interesting is the fact that while the Real Estate sector has performed magnificently, pushing to new highs recently and extending a long-term upward trend that dates back to February of 2018, WY is down about 33% over the past year. That puts the stock valuation metrics into very attractive territory, with a very attractive dividend yield to boot. Do the rest of the stock’s fundamentals hold up as well? Let’s take a look.
Fundamental and Value Profile
Weyerhaeuser Company is a timber, land and forest products company. As of December 31, 2016, the Company owned or controlled 13.1 million acres of timberlands, primarily in the United States, and manages additional timberlands under long-term licenses in Canada. The Company’s segments include Timberlands; Real Estate, Energy and Natural Resources (Real Estate & ENR), and Wood Products. The Timberlands segment’s offerings include logs, timber and recreational access via leases. The Real Estate & ENR segment includes sales of timberlands; rights to explore for and extract hard minerals, oil and gas production, and coal, and equity interests in its Real Estate Development Ventures. The Wood Products segment includes the manufacturing and distribution of wood products. The Wood Products segment is engaged in softwood lumber, engineered wood products, structural panels, medium density fiberboard and building materials distribution. WY’s current market cap is $19.1 billion.
Earnings and Sales Growth: Over the last twelve months, earnings declined almost -70%, while sales declined not quite -12%. In the last quarter, earnings increased 10%, while sales were mostly flat, but positive by .5%. WY’s margin profile is a concern; over the last twelve months, Net Income was a very narrow 2.6% of Revenues, but turned negative, by -1.75% in the last quarter.
Free Cash Flow: WY’s free cash flow is minimal, at a little over $555 million for the trailing twelve month period; that translates to a Free Cash Flow yield of about 2.89%.
Debt to Equity: WY has a debt/equity ratio of .70, a relatively low number that looks good, but is also misleading. WY’s balance sheet shows just $259 million in cash and liquid assets against $6.1 billion in long-term debt. The disproportion between these two, along with the deterioration of Net Income into negative territory, is a strong sign that the company doesn’t have adequate liquidity to cover its short-term needs, or to service its debt.
Dividend: WY pays an annual dividend of $1.36 per share, which translates to an outsized yield of 5.29% at the stock’s current price. The sustainability of this dividend is an open question mark at this stage.
Price/Book Ratio: there are a lot of ways to measure how much a stock should be worth; but one of the simplest methods that I like uses the stock’s Book Value, which for WY is $11.82 per share and translates to a Price/Book ratio of 2.17 at the stock’s current price. Their historical Price/Book average is 2.7, which suggests that the stock is actually 24% undervalued and puts the stock’s long-term target price at around $32 per share. Their Price/Cash Flow ratio offers an even more optimistic perspective, since it is currently running about 46% below its historical averages. That ratio puts a long-term target price at about $37.50 per share.
Technical Profile
Here’s a look at the stock’s latest technical chart.
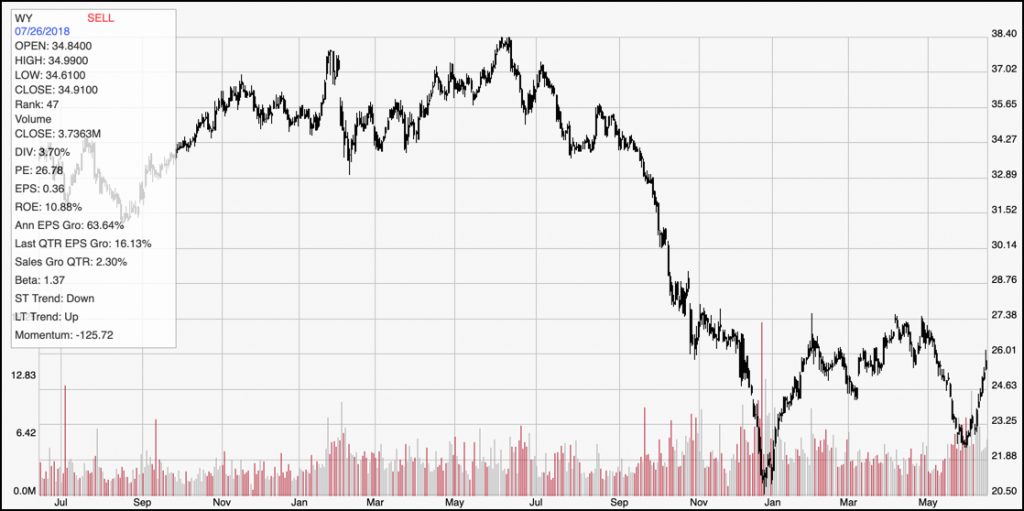
Current Price Action/Trends and Pivots: The chart above displays the last two years of market activity for WY. Long-term price movements are often a good indication not only of how the market feels about a company, but also of the reality of the stock’s fundamental status. The stock is significantly below its high in May of 2018 at nearly $38.50, and is an important counter to the fact the stock has rebounded nicely over the last two weeks from a short-term low at around $22 to its current level a little below $26. A legitimate upward trend in this stock can’t be confirmed unless, and until the stock breaks its highest point so far this year, at around $27 per share. If that happens, the stock could see some significant bullish momentum, with about $7 to run to the next most likely resistance point around $34. Current support should be at around $24.50, with a drop below that point a signal the stock could drop to $22, or possible retest its multi-year low at around $20.50.
Near-term Keys: With the stock’s deteriorating Net Income, unremarkable Free Cash Flow, and high debt, I think this is a classic example of a value trap. Don’t be fooled by the valuation metrics, or by the outsized dividend. It is true the stock could follow the broader industry pattern higher, but the fundamentals just don’t argue in favor of it. That means that the only practical way to look at this stock is on a short-term, technical basis. You could treat a break above $27.50 as a signal to buy the stock or work with call options, with an eye on closing a bullish trade at anywhere between $31 to $34 per share. On the other hand, a drop below $24.50 could be useful as a signal to consider shorting the stock or buying put options, with $20.50 to $22 pretty attractive as short-term bearish targets.