It seems like one of the only elements that really seems to get investor’s attention, aside from the latest rumor about trade and tariffs, is anything to do with interest rates. I guess that isn’t too surprising – central banking policy about interest rates has always wielded considerable influence on the financial markets. I think this is a fact that has become even more true over the last decade or so, as central banks across the world all seem to have used interest rates – specifically, to keep them as low and accommodative as possible – to massage the markets.
It doesn’t always work, of course, but the Federal Reserve’s largely accommodative stance, which was characterized by its “quantitative easing” policy after the financial crisis that began in 2008 seems mostly to have worked up to this point. I think the Fed has remained largely accommodative even as it ended QA and began raising rates; that accommodation was still reflected in the gradual, measured interest rate increases that began under previous chair Janet Yellen and only in the last few months have been paused under Jerome Powell.
While it’s easy to pin market tensions and uncertainty over the last year or so primarily on trade and tariffs between the U.S. and China, the fact is that increasing interest rates, gradual though they may have been through the end of 2018 played a role as well. As the market tested bear market levels going into Christmas 2018, there was increasing fear that increasing rates would finally tip the scale of economic growth and push the markets back into recessionary territory.
Perhaps in that sense, there has been a silver lining in the current trade conflict; while tariffs have had an effect on corporate profits, the prospect of continued, long-term tariffs between the U.S. and China are among the reasons the Fed has gone on the record as saying that they stand ready to use all of the tools at their disposal to sustain the economy. That has many analysts and investors speculating not only that the Fed will not raise rates in the future, but even that they could cut rates at least once before the end of the year.
The financial sector took a bit of a beating, especially late in 2018 as interest rate fears increased; but to this point in the year the sector has performed nicely, rallying about 13.5% since January as measured by the S&P 500 Financials Sector SPDR ETF (XLF). An accommodative Fed should generally be taken as a positive for the sector, as lower rates encourage borrowing, especially as a tool to facilitate small business growth, which has always been a primary driver of long-term economic health and stability. That bodes well for the banking industry, and not just the “big boys” of the industry, but also smaller, regionally-focused institutions like KeyCorp (KEY), a mid-cap stock that has rallied a little over 15% year to date, but is currently consolidating in a narrow trading range that could be setting up an interesting opportunity. Despite the stock’s gain so far this year, its fundamental strength and value proposition suggest there could be plenty of upside to be had, so this is a stock that might be worth putting in a watchlist. Let’s dive in.
Fundamental and Value Profile
KeyCorp is a bank holding company. The Company is a bank-based financial services company. The Company operates through its subsidiary, KeyBank National Association (KeyBank), which is engaged in providing banking services. Through KeyBank and other subsidiaries, it provides a range of retail and commercial banking, commercial leasing, investment management, consumer finance, and investment banking products and services to individual, corporate and institutional clients. Its segments include Key Community Bank and Key Corporate Bank. Key Community Bank serves individuals and small to mid-sized businesses by offering a range of deposit, investment, lending, credit card, and personalized wealth management products and business advisory services. Key Corporate Bank is a full-service corporate and investment bank focused on serving the needs of middle market clients in industry sectors, which include consumer, energy, healthcare, industrial, public sector, real estate and technology. KEY has a current market cap of $17.4 billion.
Earnings and Sales Growth: Over the last twelve months, earnings increased by 5.26%, while sales increased 5.8%. In the last quarter, earnings decreased – 16.67% while Revenues saw a smaller decrease, but were still -5.25%. KEY’s Net Income versus Revenue is impressive; over the last year this number was 24.7%, decreasing only slightly in the last quarter to 22.11%.
Free Cash Flow: KEY’s Free Cash Flow is very healthy, at a little more than $3.1 billion. That translates to a very attractive Free Cash Flow Yield of 18.6%.
Debt to Equity: KEY has a debt/equity ratio of .98, which is actually a little below the average for most banking stocks, which traditionally carry larger debt loads as a normal function of business. As of the last quarter, cash and liquid assets were $4.1 billion versus $14.1 billion in long-term debt. The difference is substantial, but not a typical; the company’s healthy Free Cash Flow and Net Income are a good indication that managing their debt is not a concern.
Dividend: KEY pays an annual dividend of $.68 per share, which at its current price translates to a dividend yield of about 3.99%, which is attractive.
Price/Book Ratio: there are a lot of ways to measure how much a stock should be worth; but one of the simplest methods that I like uses the stock’s Book Value, which for KEY is $14.45 per share. At the stock’s current price, that translates to a Price/Book Ratio of 1.18. The stock’s historical Price/Book ratio by comparison is 1.33 and puts the top end of the stock’s long-term price target only about 12% higher, at around $19 per share. A more encouraging forecast is offered by the stock’s Price/Cash Flow ratio, which is currently about 29.5% below its historical average. That put’s the stock’s long-term price target a little above $22 per share.
Technical Profile
Here’s a look at the stock’s latest technical chart.
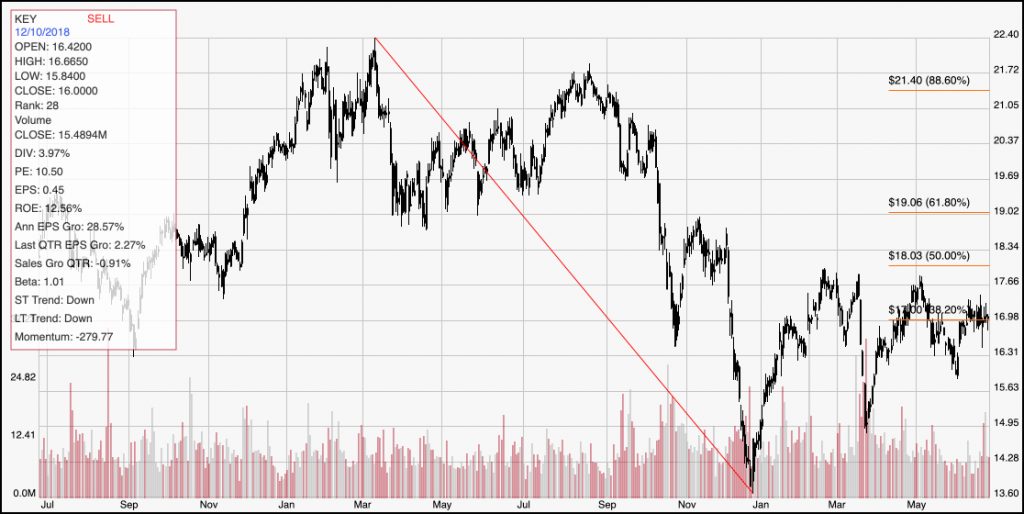
Current Price Action/Trends and Pivots: The red diagonal line defines the stock’s downward trend from March of last year to its low point at the end of 2018; it also informs the Fibonacci retracement lines shown on the right side of the chart. The stock rallied nicely, to about $18 per share by the end of February, but since that point has failed to move any higher. Since late April, in fact, the stock’s trading range has narrowed considerably, establishing a consolidation range between about $17.50 as resistance and $16 as support. The stock is currently sitting right on its 38.2% Fibonacci retracement line, which is a validation of that narrowing range and current support. The stock would have to break above $18, which is also indicated by the 50% retracement line, to reconfirm the stock’s bullish trend begun at the beginning of the year – but if that break happens, a rally to $20 or possibly even to test its 52-week highs around $22 is not out of the question.
Near-term Keys: The stock’s fundamentals are strong, and this is a stock with an interesting value proposition. As a mid-cap stock that doesn’t get as much attention from the market as the largest, most notable names in the banking industry, it may not have much upside past $22, but on a long-term basis that does look like an attractive price target. If you prefer to work with shorter-term trades, you could treat a break above $18 as a signal to buy the stock or work with call options with a near-term target between $20 and $21 per share. A drop below $16, on the other hand could be a signal to consider shorting the stock or working with put options with an eye on the stock’s December 2018 low around $13.50 as a target for a bearish trade.