Didn’t it seem like at the end of last week, the market started holding its breath, waiting for the next shoe to drop about trade? President Trump and Chinese President Xi Jinping finally met in Tokyo this weekend, with what a lot of experts seem to believe was the best realistic result of the meeting being the result. The two leaders agreed to resume talks about trade; Trump pledged not to impose new tariffs on Chinese goods and to ease some of the U.S. restrictions on Chinese tech giant Huawei, while Xi agreed to increase imports of U.S. farm goods.
While it looks like the market is set to use the news in a mostly bullish fashion going into this week, the truth is that a deal isn’t done, and is likely to continue to take some time to finalize. Still, the resumption of negotiations is a positive, since both sides had simply stopped talking since the beginning of May. Investors seem anxious for any shred of hope that a deal with be reached, and so even a thaw in this chilly relationship is going to be used as a reason to be more optimistic. In the near-term, that bodes well for stocks in any sector with exposure to trade and tariff risk, including Materials. The sector is up about 12% year to date, but dropped a little over 10% from late April to the beginning of June, primarily on trade tensions. Since that point, the sector has pushed back to the pivot high it claimed in mid April.
One of the most interesting stocks in the Materials sector is Huntsman Corp. (HUN), a mid-cap Chemicals company that has followed the sector’s trend this year, but to much more volatile extent. The stock hit a multi-year low in December 2018 before rallying almost 44% below the end of April. It then dropped back to that multi-year low and has since managed to rebound about 18% from that point. Despite those positive moves, the stock remains at the extreme low end of its historical ranges. Their fundamentals are generally solid, but are also showing some signs of weakness that seem to reflect some of the economic pressures that have come from increasing commodity costs and from trade difficulties, as U.S. companies in this sector derive a significant portion of their revenues from exports to China. Does that mean HUN is a stock to say away from, or does it create a useful value-oriented opportunity for the smart long-term investor?
Fundamental and Value Profile
Huntsman Corporation is a manufacturer of differentiated organic chemical products and of inorganic chemical products. The Company operates all of its businesses through its subsidiary, Huntsman International LLC (Huntsman International). The Company operates through five segments: Polyurethanes, Performance Products, Advanced Materials, Textile Effects, and Pigments and Additives. Its Polyurethanes, Performance Products, Advanced Materials and Textile Effects segments produce differentiated organic chemical products and its Pigments and Additives segment produces inorganic chemical products. The Company’s products are used in a range of applications, including those in the adhesives, aerospace, automotive, construction products, personal care and hygiene, durable and non-durable consumer products, digital inks, electronics, medical, packaging, paints and coatings, power generation, refining, synthetic fiber, textile chemicals and dye industries. HUN’s current market cap is $4.8 billion.
Earnings and Sales Growth: Over the last twelve months, earnings declined a little over -52%, while revenues dropped -11.37%. In the last quarter, earnings declined about -11.5% while revenues dropped a little more than -9%. The company’s narrow margin profile is improving, however, with Net Income as a percentage of Revenues at 5.89% in the last quarter versus only 1.99% in the last twelve months.
Free Cash Flow: HUN’s free cash flow is healthy at $685 million. That translates to a Free Cash Flow Yield of 14.3%. It is noteworthy that Free Cash Flow has declined from $894 million earlier this year, and about $1.2 billion since June 2018.
Debt to Equity: HUN has a debt/equity ratio of .96. This is a conservative number, but it increased from .57 in the third quarter of 2018. The improvement in the company’s Net Income is also reflected by an increase in liquidity, which is a positive development. Total cash in the last quarter was $444 million, while long-term debt is $2.7 billion.
Dividend: HUN pays an annual dividend of $.65 per share, which translates to an annual yield that of about 3.18%.
Price/Book Ratio: there are a lot of ways to measure how much a stock should be worth; but one of the simplest methods that I like uses the stock’s Book Value, which for HUN is $12.28, and which translates to a Price/Book ratio of 1.66 at the stock’s current price. HUN’s Book Value improved in the last quarter from $11.53 per share. Their historical average Price/Book ratio is 2.46, which means the stock is current sitting almost 48% below a long-term target price at around $30 per share. That number is supported by a Price/Cash Flow ratio that is about 31% below its historical average.
Technical Profile
Here’s a look at the stock’s latest technical chart.
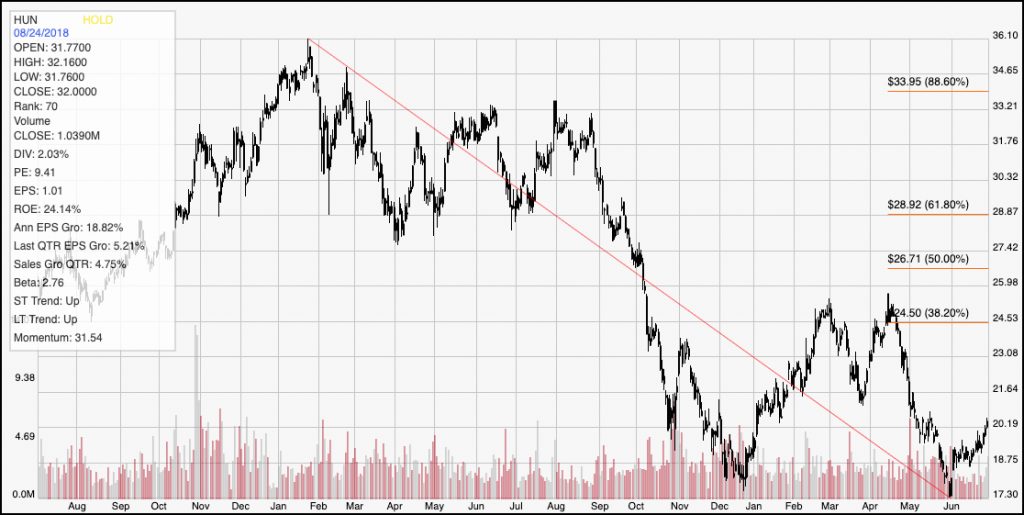
Current Price Action/Trends and Pivots: The diagonal red line on the chart above traces the stock’s downward trend from the beginning of 2018 to its low point in early June. It also provides the baseline for the Fibonacci retracement lines shown on the right side of the chart. The stock has increased from that recent low at around $17.30 per share, with a strongly bullish push to about $20.50 as of this writing. Current support is between $18.75 and $19 based on a short-term consolidation pattern from early in June, with most likely current resistance right around the stock’s current price. A slight pullback in price, with a new pivot around the $19 range, could provide a good continuation pattern for the stock’s current bullish momentum, with the next resistance point at around $21.50. I would put confirmation of the current short-term upward trend at a break above that $21.50 point, with about $3 per share of short-term opportunity to test the 38.2% Fibonacci retracement at around $24.50.
Near-term Keys: The stock’s recent rebound from its trend low makes looking for a short-term bearish trade a very low probability trade; in the short-term, the best likelihood of success is on the bullish side, with a break above $21.50 offering a good signal to buy the stock or to consider working with call options with an eye on the stock’s high between $24.50 and $25 from earlier this year. From a value perspective, the company is showing some useful signs of improving fundamental strength, with a bargain proposition that is quite attractive at current price levels. Progress on the trade front is likely to boost the sector as well, which means this could be a good time to think about HUN as a solid long-term opportunity.