One of the best-performing sectors in the stock market since the beginning of the year has been the Consumer Staples sector. After bottoming with the rest of the market on Christmas Eve in 2018, the sector has rallied a little over 20% as of this writing. In fact, this sector was one of the only sectors in the entire market that managed to withstand the effect of re-emerging trade fears in May, and just before breaking for the July 4th holiday had pushed to a fresh new high. That should be a good thing for most stocks in the sector, including Food stocks, but one of the stocks that I’ve been following for quite some time hasn’t joined the party.
The Kroger Co. (KR) is in the midst of a downward trend that dates back to September of last year. The market has really beaten up the stock over the period, from a September high at around $33 to its current level at about $21.50. That bearish momentum appears to have been picking up steam in the last month, as the stock has dropped another -8%. Why the bleak outlook? Late last year, the market began to price in uncertainty for the company around its ability to compete with larger big-box retailers like Walmart (WMT), Target Stores (TGT) and even Amazon (AMZN) as the grocery space gets even more competitive than ever. AMZN’s acquisition of Whole Foods, in particular seems to be the kind of market-disrupting event that has a lot of experts and analysts expecting the entire industry to be forced to change.
Most of the bearish sentiment around KR, in fact seems to have a pessimistic bent to the company’s ability to adapt to a dramatically changing competitive landscape, as well as on the long-term effectiveness of a transformation strategy management began to put in place in 2018. Called Kroger Restock, the 3-year plan included intensive levels of investment and capital allocation in technology and the development of new, alternative revenue streams that for the time being have been shown to be a drag on the company’s balance sheet. The benefits from those investments may not be seen until 2020, which could mean that if you think KR’s strategy will work, you may have to work with a very long-term view. Working in the company’s favor, however, is cash flow that remains healthy and value proposition that seems to be even better now than it was just a few weeks ago.
Fundamental and Value Profile
The Kroger Co. (KR) manufactures and processes food for sale in its supermarkets. The Company operates supermarkets, multi-department stores, jewelry stores and convenience stores throughout the United States. As of February 3, 2018, it had operated approximately 3,900 owned or leased supermarkets, convenience stores, fine jewelry stores, distribution warehouses and food production plants through divisions, subsidiaries or affiliates. These facilities are located throughout the United States. As of February 3, 2018, Kroger operated, either directly or through its subsidiaries, 2,782 supermarkets under a range of local banner names, of which 2,268 had pharmacies and 1,489 had fuel centers. As of February 3, 2018, the Company offered ClickList and Harris Teeter ExpressLane, personalized, order online, pick up at the store services at 1,056 of its supermarkets. P$$T, Check This Out and Heritage Farm are the three brands. Its other brands include Simple Truth and Simple Truth Organic. KR has a market cap of $17.2 billion.
Earnings and Sales Growth: Over the last twelve months, earnings declined by about -1.37%, while sales were mostly flat, but slightly negative at -0.74%. In the last quarter, earnings and sales improved; earnings increased by about 50%, while revenues improved by almost 33%. The company operates with very narrow margins, as Net Income was about just 1.53% of Revenues for the last twelve months, but managed to improve somewhat in the most recent quarter to 2.0%. That might not sound like much, but this also marks a reversal of a trend that saw Net Income deteriorating on a steady basis throughout 2018 as the company focused on investing in its transformation efforts.
Free Cash Flow: KR’s free cash flow is healthy, at a little over $1.1 billion. That marks an improvement from around $685 million in late 2018, and translates to a free cash flow yield of 6.37%. The company has good liquidity, with $1.5 billion in cash and liquid assets. This number also improved, from about $1.3 billion at the end of 2018.
Debt to Equity: KR has a debt/equity ratio of 2.16. This is higher than I usually prefer to see, but isn’t unusual for Food Retailing stocks. The company’s balance sheet indicates that operating profits are more than adequate to repay their debt. The fact this number jumped from 1.54 in the previous quarter shouldn’t be ignored, and is another reflection of the capital-intensive investments in itself the company is making to stay competitive in its market.
Dividend: KR pays an annual dividend of $.64 per share, which translates to a yield of about 2.97% at the stock’s current price.
Price/Book Ratio: there are a lot of ways to measure how much a stock should be worth; but one of the simplest methods that I like uses the stock’s Book Value, which for KR is $10.58 per share. At KR’s current price, that translates to a Price/Book ratio of 2.03 at the stock’s current price. The stock’s historical average is 3.9. A rally to par with the historical average would put the stock above $41 per share. That provides a long-term target price not farm from the stock’s multiyear high point in early 2016. A more conservative target is offered by the stock’s historical Price/Cash flow ratio, which is 60% above the stock’s current price at about $34.50.
Technical Profile
Here’s a look at the stock’s latest technical chart.
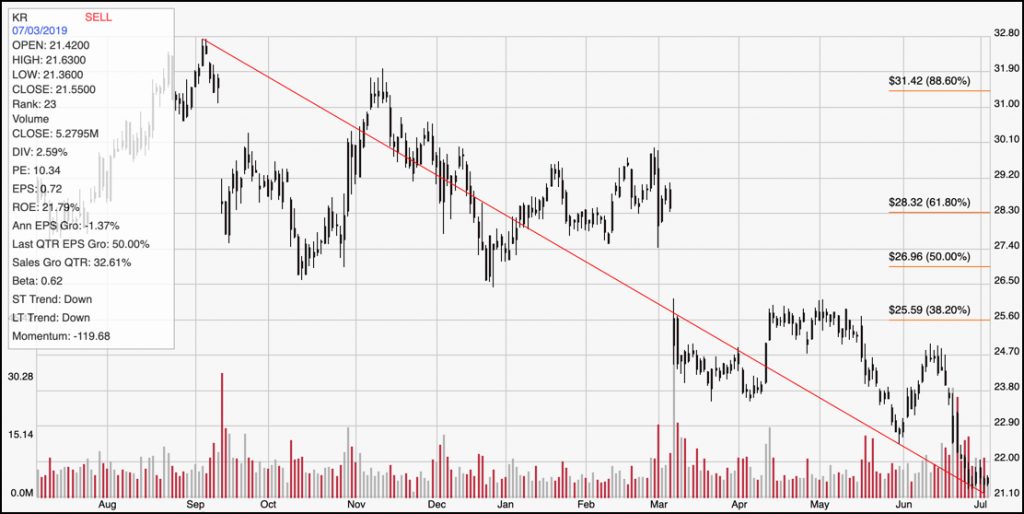
Current Price Action/Trends and Pivots: The red diagonal line on the chart above marks the stock’s downward trend over the last ten months. It also provides the baseline for the Fibonacci retracement lines shown on the right side of the chart. KR has seen a significant drawdown in price over the last couple of weeks, dropping from around $25 in mid-June to a new 52-week low below $22 in just the last few days. A reversal of the current bearish trend would require the stock break that $25 peak at minimum, with a push above the 38.2% retracement line at about $26 acting a strong confirmation level for a new bullish trend. Immediate resistance, however is around $23 from the stock’s recent pivot low at that point. Support is somewhere between $20 and $21 based on previous pivots in late 2017, which also mark the lowest points the stock has seen in the last ten years.
Near-term Keys: Given the strength of the stock’s current bearish momentum, it’s hard to say that there is a basis for a short-term bullish trade on KR. If the stock can break immediate resistance at around $23, there could be a near-term opportunity to buy the stock or work with call options with a very short-term target at around $26 per share. If the stock’s current support around $20 doesn’t hold, it could drop to as low as $15.50 per share – levels the stock hasn’t seen since August of 2008 before the last, broad-based bear market. That means that a push below $20 could offer an interesting signal to short the stock or work with put options. If you believe management’s long-term transformation strategy will begin to bear fruit in 2020 as they continue to project, the stock’s current price level provides an interesting bargain point to work with; but you may have to be willing to be patient as the market doesn’t seem to be very keen to play along just yet.