In the last week I’ve been focusing my attention in this space on a few of the biggest, most established names in the pharmaceutical space. It’s an industry that I think is becoming more interesting under current market conditions, as some of these names remain significantly off of multi-year, or even all-time highs even as the rest of the industry has been turning back into favor with institutional investors.
Pharmaceutical companies have to work with a very different business model than most businesses in the global economy. Governmental regulation, on one hand imposes tight controls on the process to take a single drug from the development stage to consumer delivery, which means that it usually takes years, and massive amounts of capital to obtain all of the government approvals necessary to get a drug to market. It’s also an intensely competitive market, which means that companies have to be able to maintain an active pipeline of new, upcoming drugs to take the place of older drugs that are becoming less relevant in the marketplace.
One of the things that usually helps makes a drug successful when it is first released is the exclusivity that comes from patent protections. The product portfolio for Eli Lilly and Co. (LLY) is a good example of how this works. LLY’s erectile dysfunction drug, Cialis, saw its sales peak around $2.5 billion in 2016; but after its patents expired, sales declined about 20% in 2018 to about $1.9 billion. That decline was offset by sales of Trulicity, a diabetes treatment that is still early in its exclusivity period, and that still has several years remaining before its patents expire. This is a company that currently derives more than half of its annual revenue from its top six drugs, and that maintains a big development pipeline, with more than 60 ongoing clinical trials in various phases as of February of this year.
While the healthcare sector in general has seen a nice rebound since the beginning of June, LLY’s price performance has underwhelmed; the stock is down almost -4% in the last month, and is about -15% below an all-time high around $132 that was reached in late March of this year. As one of the biggest U.S. pharmaceutical companies, LLY has some interesting fundamental strengths working in its favor, and others that raise some red flags. Should you pay closer attention to this stock, or would it be better to wait for a more attractive price?
Fundamental and Value Profile
Eli Lilly and Company is engaged in drug manufacturing business. The Company discovers, develops, manufactures and markets products in two segments: human pharmaceutical products and animal health products. The Company’s human pharmaceutical business segment sells medicines, which are discovered or developed by its scientists. Its animal health business segment develops, manufactures and markets products for both food animals and companion animals. The Company’s human pharmaceutical products include endocrinology products, neuroscience products, oncology products, immunology products and cardiovascular products. The Company’s animal health products segment includes products for food animals and products for companion animals. As of December 31, 2018, the Company manufactured and distributed its products through facilities in the United States, Puerto Rico and 14 other countries.LLY has a current market cap of $109.5 billion.
Earnings and Sales Growth: Over the last twelve months, earnings were mostly flat, but slightly negative, at -0.75%, while sales declined -10.5%. In the last quarter, earnings remained flat (0% growth) while the decline in revenue accelerated nearly -21%. LLY’s Net Income versus Revenue is impressive; over the last year this number was 25%, but improved in the last quarter to almost 83%.
Free Cash Flow: LLY’s Free Cash Flow is healthy, at a little more than $4.2 billion. This is a number that has declined steadily from about $5 billion in the 4th quarter of 2017.
Debt to Equity: LLY has a debt/equity ratio of 5.5, which makes LLY the most highly leveraged company in its industry. The company’s balance sheet shows that long-term debt increased from about $9 billion at the beginning of 2019 to about $14.1 billion in the last quarter. Over the same period, the company’s liquidity is also showing signs of significant deterioration, since cash and liquid assets has declined from $7.5 billion at the beginning of the year to $2.1 billion in the most recent quarter. Their impressive operating margins mean that they should have no problem servicing their high debt; however any potential shortfall in operating profits could challenge their ability to maintain debt payments.
Dividend: LLY pays an annual dividend of $2.58 per share, which at its current price translates to a dividend yield of about 2.29%.
Price/Book Ratio: there are a lot of ways to measure how much a stock should be worth; but one of the simplest methods that I like uses the stock’s Book Value, which for LLY is just $2.64 per share. This number declined from $10.30 in the quarter previous, which from a value-based standpoint is a big red flag. At the stock’s current price, their Price/Book Ratio is 42.73. The stock’s historical Price/Book ratio by comparison is 6.24 and puts the top end of the stock’s long-term price target at just above $16 per share. A distinctly contrasting view is offered by the stock’s Price/Cash Flow ratio, which is currently almost 24% below its historical average, and offers a long-term target price above its March 2019 high, at around $139 per share.
Technical Profile
Here’s a look at the stock’s latest technical chart.
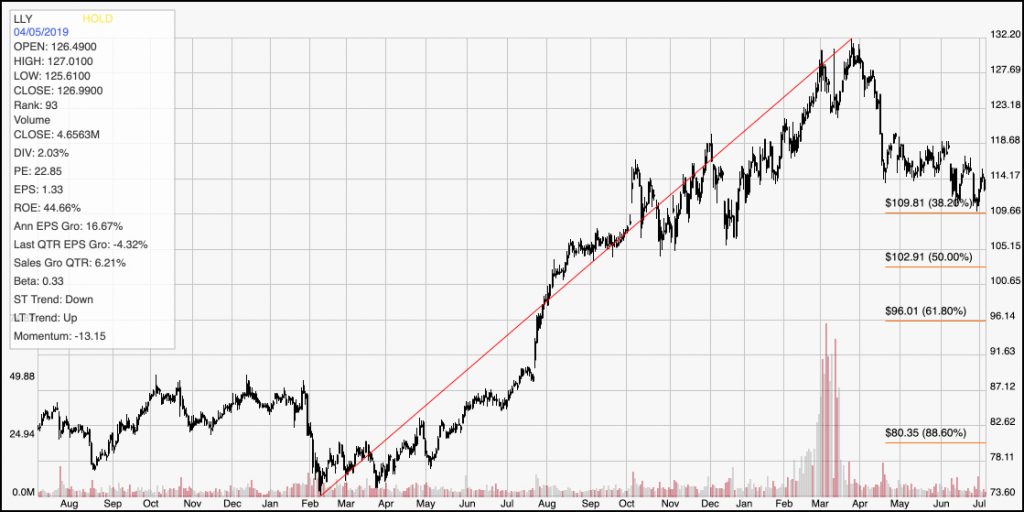
Current Price Action/Trends and Pivots: The red diagonal line defines the stock’s upward trend from February of 2018 to now; it also informs the Fibonacci retracement lines shown on the right side of the chart. After reaching an all-time high at around $132, the stock dropped quickly in April to about $114 per share. From that point, its downward trend has slowed, but seen the stock continue to fade to its current price around $112 per share. Its most immediate support can be seen with the 38.2% Fibonacci retracement line, at around $110 per share, with near-term resistance sitting at around $118 per share. A break above that resistance point, to about $119 would be required to see the stock set a sustainable reversal of the current downward trend, with its next resistance point somewhere between $123 and $127 per share. If the stock’s current support doesn’t hold, it could drop to somewhere between $102 to $105, in the neighborhood of the 50% Fibonacci retracement line.
Near-term Keys: LLY is an interesting study in contrasts; they operate with a large, even outsized operating profile, but have seen significant deterioration in the business’ cash flows and its intrinsic value that are alarming to say the least. At least some of the company’s high debt load can be attributed to a recent $8 billion acquisition of Loxo Oncology, which added highly selective potential treatments for patients with genomically defined cancers to its development pipeline. Whether that move yields the anticipated results may not be known for some time, but the near-term effect on the balance sheet, as well as on the stock’s valuation metrics to me means that the best probabilities for success with this stock lie on the short-term side, momentum-based trades offering the most attractive opportunities. A break above $118 would be a strong bullish signal to work with call options, or to buy the stock itself, with a short-term target between $123 and $127. A drop below $110, to $109 would mark a good signal to consider shorting the stock or buying put options with a near-term target at around $105 to as low as $102.