2019 has been an interesting year for investors so far; we’ve watched the market raD to a new all-time high after testing near-bear market levels into Christmas 2018. One of the things that has marked this new bullish raD has been the fact that defensive sectors have been among the biggest winners. While the raD has been pretty broad based, sectors like Consumer Staples and Utilities have seen double-digit gains to put them not far off the pace of sectors that are traditionally considered market leaders during bullish periods like Technology or Industrials.
Why is the raD in sectors most investors consider “defensive” more interesting than normal? The fact is that despite the raD to new broad-based highs, the market has remained pretty volatile, with plenty of uncertainty associated with the health of the global and U.S. economy coming from still-unresolved trade issues, and speculation about how accommodative the Fed will be able to remain despite its assurances to be “patient” about any future interest rates. The market’s quick drop in the last quarter of last year also seemed to make investors aware of the reality that when the inevitable bearish reversal does finally come, it could come very quickly. I think that’s a big reason that defensive sectors have been attractive to many investors, who like me have been looking for attractive value in areas of the market that may be able to provide some sense of stability even if the economy does begin to turn bearish yet again.
Utilities tend to be attractive as defensive investments because stocks in this industry tend to pay larger than average dividends, offering yields that usually compete favorably with Treasury bonds and other instruments that investors often associate with “flight to quality”-type investments. They also tend to hold up well during period of economy difficulty because of their stable revenue streams; after all, we’ve got to keep the lights on and the heat running in our homes and businesses throughout the year no matter what the economy is doing. This is a sector that generaD falls into the category of “must have” versus “nice to have” that a lot of us might consider when economy concerns start to impose spending and budget restrictions on a consumer level.
As I’ve looked over the Utilities sector, I’ve found companies that offer an interesting contrast between value and fundamental strength and concern. High levels of debt, for example, aren’t all that unusual, even among the biggest companies in this industry, and while revenues have remained healthy, for a number of companies in the sector, cash flows raise red flags about many of these company’s ability to service their debt. Those work against valuation metrics that make even large-cap stocks like Dominion Resources (D) look like impressive bargains despite their healthy rallies to this point in the year. Market sentiment may provide some insulation against typical market volatility for stocks in this sector, but if an economic downturn does come in the near future, will the sector be able to maintain its growth? I’m not so certain.
Fundamental and Value Profile
Dominion Energy, Inc., formerly Dominion Resources, Inc., is a producer and transporter of energy. Dominion is focused on its investment in regulated electric generation, transmission and distribution and regulated natural gas transmission and distribution infrastructure. It operates through three segments: Dominion Virginia Power operating segment (DVP), Dominion Generation, Dominion Energy, and Corporate and Other. The DVP segment includes regulated electric distribution and regulated electric transmission. The Dominion Generation segment includes regulated electric fleet and merchant electric fleet. The Dominion Energy segment includes gas transmission and storage, gas gathering and processing, liquefied natural gas import and storage, and nonregulated retail energy marketing. As of December 31, 2016, Dominion served utility and retail energy customers, and operated an underground natural gas storage system with approximately one trillion cubic feet of storage capacity. D has a current market cap of $62.7 billion.
Earnings and Sales Growth: Over the last twelve months, earnings declined somewhat at -3.5%, while sales improved a little over 11%. In the last quarter, earnings grew about 23.6% while sales increased almost 15%. D’s Net Income versus Revenue is another example of contrasts; over the last twelve months, the company’s operating margin was healthy at a little more than 9%, but turned sharply negative at -17.6% in the last quarter.
Free Cash Flow: D’s Free Cash Flow is minimal, at a little more than $613 million over the last twelve months. That translates to a little under 1% on a Free Cash Flow Yield basis. That is unimpressive, but it should be noted that Free Cash Flow improved from -$683 million over the same period a year ago.
Debt to Equity: D has a debt/equity ratio of 1.35, which which is higher than I usually prefer to see, but isn’t unusual for stocks in the Utilities sector. The company’s balance sheet shows that long-term debt was $37.2 billion in the last quarter versus just $422 million in cash and liquid assets. Along with their negative Net Income in the last quarter, this raises concerns about the company’s liquidity, including whether or not they have adequate resources to cover even short-term cash needs. As long as interest rates remain low, utilities like D can keep borrowing to cover those needs; but if the Fed is forced to start raising rates again, it could be a poison pill for highly leveraged companies like D who are already under pressure to service they debt they have.
Dividend: D pays an annual dividend of $3.67 per share, which at its current price translates to a dividend yield of about 4.71%. It shouldn’t be lost on your analysis that the company is paying out more in dividends than they are bringing in, which is another indication of the company’s questionable liquidity. The stability of that dividend has to be another red flag.
Price/Book Ratio: there are a lot of ways to measure how much a stock should be worth; but one of the simplest methods that I like uses the stock’s Book Value, which for D is $34.40 per share. At the stock’s current price, their Price/Book Ratio is 2.27. The stock’s historical Price/Book ratio by comparison is 3.22 and puts the top end of the stock’s long-term price target at almost $111 per share. The stock’s Price/Cash Flow ratio is currently about 9% below its historical average, and offers a more conservative long-term target price at around $85 per share.
Technical Profile
Here’s a look at the stock’s latest technical chart.
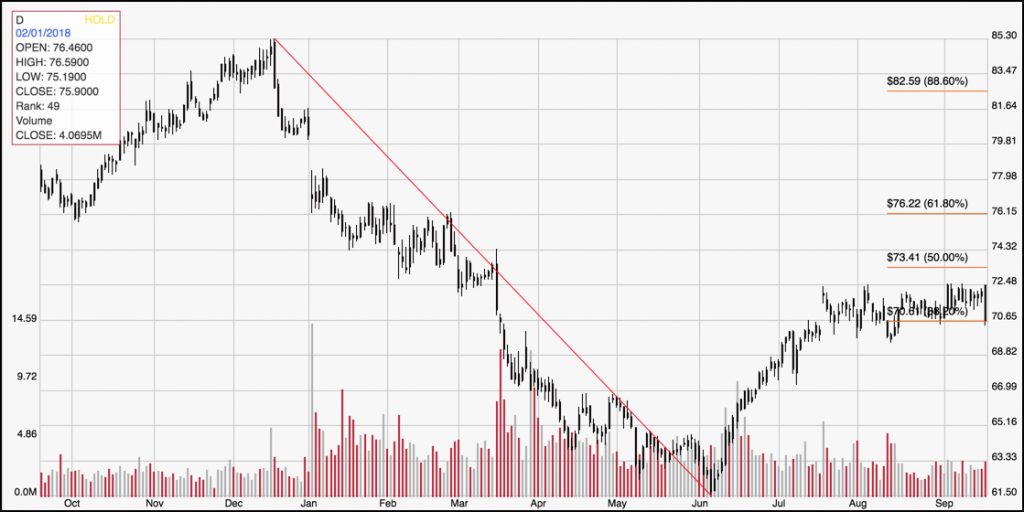
Current Price Action/Trends and Pivots: The chart above displays the stock’s price activity over the last two years. Since finding a downward trend low at around $61.50 in June 2018, D has managed to stage an impressive upward trend, increasing about 27% over that period. The stock is just a little below its latest 52-week high and has increased about 5% over the last month, but is still about -10% below its multiyear high from December 2018 at around $85 per share. Current resistance is at around $79 per share, with current support in the $76 price area. A break above current resistance, to about $80 should offer near-term upside to the $85 range at the stock’s two-year high, while a drop below $76 could see the stock test its next support in the $72 to $72.50 price range.
Near-term Keys: Despite an attractive value proposition based on the stock’s Price/Book metric, I’m not confident about calling D an attractive value play. There are too many fundamental questions coming from the company’s high debt levels versus deteriorating Net Income. Cash flow has turned positive, but is minimal enough that a reversal to negative cash flow isn’t out of the question. I think it would be necessary to see the company establish a pattern of improving cash flows over consecutive quarters, along with stabilization and improvement in Net Income before I would be willing to take this stock any kind of an attractive long-term investment. That means that the best opportunities to work with this stock lie on the momentum side. Treat a push to $80 as a signal to buy the stock or start working call options with an eye on $85 as a price target over a three to four-month period, while a break below support at $76 could offer an opportunity to short the stock or work with put options with a low target at around $72 per share.