The stock market’s rally since May has been good for a number of sectors, including Consumer Discretionary stocks. The sector is about 8.5% higher since the beginning of June, and nearly 21% year to date. With the biggest, most well-known names like Walmart (WMT), Amazon (AMZN) and Target Stores (TGT) leading the charge, the assumption that most would make is that “a rising tide lifts all ships.”
While the sector’s improvement has been good for most stocks in the sector, one well-known name that has diverged from that performance is Kohls Corporation (KSS). Since mid-April, the stock is down a little more than -37%. The decline was accelerated by an $8 per share overnight drop in late May after the company’s latest earnings report came in significantly lower than expected. Not only were the company’s numbers lower in the previous quarter, but management also lowered their forecast for the next twelve months. In that context, it isn’t particularly surprising to see that the market has hammered the stock.
Since bottoming in June at around $46, KSS appears to be stabilizing, and has even rallied a bit from that point. The real question now is whether the stock’s could finally be reaching a consolidation stage that could help the stock rally higher, or is this just a temporary pause in a downward trend that extends all the way back to November of last year? From a technical analysis viewpoint, the longer trend should guide the near-term forecast for the stock’s prospects; but what about the fundamental and value-based view? Does the company’s underlying business operations, along with its currently discounted price mark an opportunity, or just another value trap?
Fundamental and Value Profile
Kohl’s Corporation (Kohl’s) is an operator of department stores. The Company operates approximately 1,154 Kohl’s department stores, a Website (www.Kohls.com), approximately 12 FILA outlets, and approximately three Off-Aisle clearance centers. The Company’s stores and Website sell moderately-priced private label and national brand apparel, footwear, accessories, beauty and home products. The Company’s Website includes merchandise that is available in its stores, as well as merchandise that is available only online. The Company’s merchandise mix includes both national brands and private brands that are available only at Kohl’s. The Company’s private brands include Apt. 9, Croft & Barrow, Jumping Beans, SO and Sonoma Goods for Life. The Company’s exclusive brands include Food Network, Jennifer Lopez, Marc Anthony, Rock & Republic and Simply Vera Vera Wang. KSS’s current market cap is $7.7 billion.
Earnings and Sales Growth: Over the last twelve months, earnings and sales both declined, with earnings -4.5% lower, whiles sales declined -2.88%. In the last quarter, the pace of decline accelerated dramatically, with earnings almost -73% lower, while sales dropping -40%. The company’s margin profile has historically been narrow, but is showing signs of significant deterioration. In the last twelve months Net Income was 3.92% of Revenues, and only 1.51% in the last quarter. That appears to be a strong sign that costs are increasing, which could be a stumbling block in the quarters ahead.
Free Cash Flow: KSS’s free cash flow is generally healthy, at $1.17 billion. That translates to a Free Cash Flow Yield of 14.8%, which admittedly is impressive; but it should also be noted that earlier this year free cash flow was markedly higher, at about $1.7 billion.
Debt to Equity: KSS has a debt/equity ratio of 1.06, which also marks an increase from .7 just a couple of quarters ago. The company’s balance sheet reflects a shift from the last quarter of 2018. Cash and liquid assets are almost 50% lower, to about $543 million, while debt increased from $400 million in the same quarter of last year to $5.7 in the most recent quarter. Along with the stock’s deteriorating Net Income, this is an indication that the company’s liquidity, along with their ability to service their debt is in question.
Dividend: KSS’ dividend is $2.65 per share, which translates to an attractive yield of about 5.61% at the stock’s current price.
Price/Book Ratio: there are a lot of ways to measure how much a stock should be worth; but one of the simplest methods that I like uses the stock’s Book Value, which for KSS is $33.35. At the stock’s current price, their Book Value translates to a Price/Book ratio of 1.43 versus an average Price/Book ratio of 1.86, which means the stock is undervalued by 29%. That offers a long-term target price at around $62, a level that is supported by the stock’s Price/Cash Flow ratio, which is also 29% below its historical average.
Technical Profile
Here’s a look at the stock’s latest technical chart.
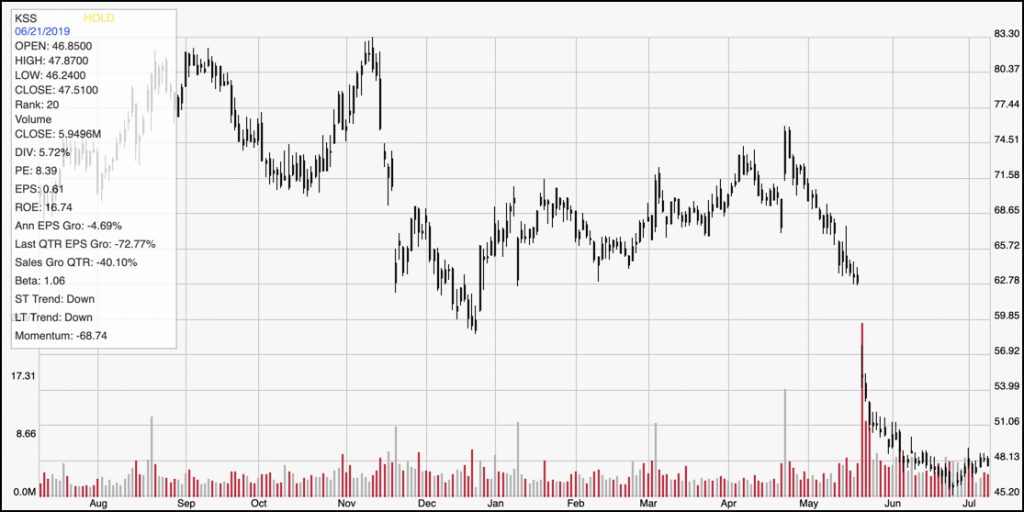
Current Price Action/Trends and Pivots: The chart above shows the last year’s worth of price movement for KSS. The downward trend is clear, dropping from a high around $83 to its current price. The stock’s consolidation range since June is also clear, with current support at around $46 and near-term resistance just about the stock’s current price between $48 and $49 per share. Given the pace of the stock’s decline since May, a reversal of the stock’s long-term downward trend can’t be considered on a realistic basis unless the stock can break above about $57 per share. That’s significantly above the stock’s current price, and would likely require enough time to build at least an intermediate-term upward trend. Given the company’s current fundamental concerns, that seems unlikely unless or until management can demonstrate significant improvements in its balance sheet and earnings performance.
Near-term Keys: Despite the stock’s discounted price based on recent performance, I don’t think it’s a good time to think of KSS as a strong value candidate. The company is in the midst of a transformation effort that includes efforts to reduce its reliance on third-party brands and a partnership with AMZN to facilitate product returns on a localized basis. The early returns from that work is yet to be seen, but until management can demonstrate that their strategy is working in a way that benefits the bottom and strengthens the company’s balance sheet, I think the greatest probabilities lie on the bearish side. A break below support at $46 could offer an opportunity to short the stock or work with put options with a target price at around $40 per share – a level last seen in late 2017. If the stock can start to build bullish momentum with a bullish break to about $49, the stock could rally in the near-term to as high as $55 or $56, which is about halfway between the total distance of the stock’s overnight drop in late May. If you don’t mind being aggressive, that might offer an opportunity to work with call options or to simply buy the stock itself.